If you are in the habit of tuning in to the daily financial news, your instinctive notion of “the market” is probably based on one of the Big Three – the S&P 500, the Dow Jones Industrial Average or the Nasdaq Composite – that always feature in the daily market wrap-up. “The Dow ended the day down 100 points,” or whatever, is what you’ll hear as the nightly news comes on.
That may sound informative, but it’s really not, for a couple reasons. With the Dow in particular, news reporters have a fascination with talking points, rather than the more important measure of percentage gain or loss. This happens especially on one of those days when the markets are down a lot, because talking about a “loss of hundreds of points” can be a psychological hook to get the listener’s attention. The Dow closed down 461 points this past Wednesday – wow! But that point loss was relative to an index value of 34,483, equating to a percentage loss of 1.3 percent. Significant, but not dramatic. The perspective is important, but often gets lost in the talking heads’ efforts to pump up the fear volume.
Thirty versus Three Thousand
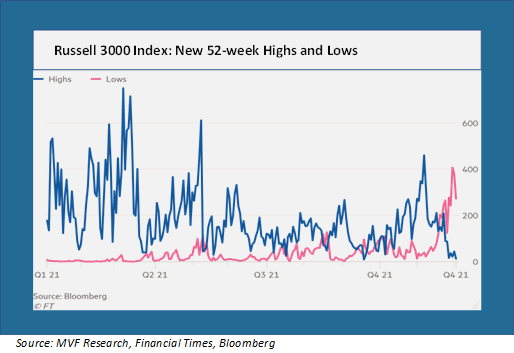
The other problem with equating the Dow with “the market” is that the thirty companies therein represent a tiny fraction of the total number of companies out there with traded shares. Big companies, to be sure, and on the basis of market capitalization they carry a huge amount of weight. But sometimes it’s important to know what’s going on outside the bubble of the giant companies whose performance dominates indexes like the Dow or the S&P 500. Take the Russell 3000, for example. This is an index containing everything from giant mega-caps like Apple and Amazon, with market caps of more than $1 trillion each, to tiny companies like Hookipa Pharmaceutical, with a market cap of less than $100 million. Some interesting things have been going on in the Russell 3000 as of late. Consider the chart below.

What’s odd about that chart? In a market environment where all major indexes are not far off their record highs – and have been setting record high after record high for much of the year – the number of companies setting new 52-week lows is much larger than the number of companies setting 52-week highs. As you can see, more than 250 companies set a new 52-week low yesterday (the red line in the chart) while only 13 (the blue line) set new highs.
What does this tell us? It tells us that when we say the “market” is close to its all-time high, we really mean that a small number of companies have been doing the heavy lifting while many more companies are actually not doing well at all. Below the surface, things are not necessarily as spiffy as they might seem.
Are Small Caps the Canary in the Coal Mine?
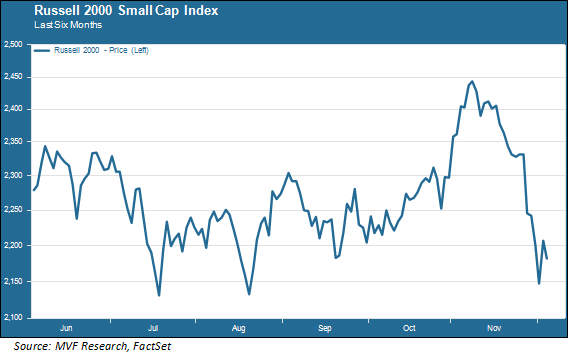
Those 250-odd new lows in the above chart don’t all represent small companies, but a look at the overall performance of small cap indexes recently will show that this segment of the market is doing worse than its large cap counterpart. The Russell 2000, a small cap index shown in the chart below, has lost more than 12 percent of its value recently, compared to a loss of approximately four percent in the large cap S&P 500. That puts the Russell 2000 in a technical correction.

While small cap trends have sometimes been an indicator of things to come in the overall market, that is by no means a statistically reliable predictor. Still, the combination of a move away from riskier corners of the market, along with the recent sharp increase in the number of companies hitting new 52-week lows, suggests that it might be a time for caution. Bear in mind as well that even with the recent pullback, equities are still expensive by most valuation metrics. There is the heightened uncertainty around the new omicron variant of Covid, and in particular how the new variant could potentially worsen the already-present inflation problem. Not to mention how the Fed deals with inflation as events force it to reevaluate the longstanding assumption of it being a transitory phenomenon.
On the other side of the argument there is always the “buy the dip / there is no alternative” mantra that has been plenty resilient in other recent periods of unrest. Think about it – an investor holding equities who thinks 4-5 percent inflation is going to stick around for awhile is unlikely to dump her stocks and jump into bonds when the nominal rate on the 10-year Treasury is barely breaking 1.5 percent. TINA (there is no alternative) may still be the most compelling case to make. But things certainly have the potential to be in for a bumpy ride.