Meet the new year, same as the old year…or so it would seem by the price dynamics of the S&P 500 in the early weeks of 2024. On the way to achieving another one of those round-number milestones so beloved by the financial media talking heads, it was the usual mega-cap stalwarts leading the way. Meta (Facebook) and chipmaker Nvidia have been particular standouts on the road to 5,000 for the blue chip index, though Tesla’s Magnificent Seven credentials appear to be at least temporarily suspended as the carmaker has been struggling on a variety of fronts.
Multiple Distortions
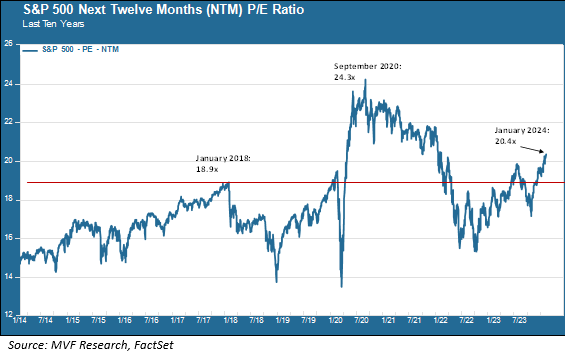
One thing that is different between today and a year ago – unsurprisingly given the stonking 26.3 percent total return for the S&P 500 in 2023 – is that stocks are a whole lot more expensive than they were. How expensive, though? That question is a bit tricky, depending on how one is inclined to think about the wild distortions of the pandemic period. Let’s consider the numbers. The chart below shows the forward (next twelve months) price-to-earnings ratio for the S&P 500 for the past ten years.

So, hot or not? We could take a glass-half-empty or glass-half-full approach. On the one hand, today’s NTM P/E of 20.4 times is lower than where it was throughout most of 2020 and 2021, when at one point valuation levels were closing in on the nosebleed territory of the dot-com bubble of the late 1990s. On the other hand, if you take away the pandemic distortion – lower earnings as the economy shut down and higher prices fueled by the Fed’s liquidity shower – the P/E ratio today is at its highest level since 2014.
The glass-half-empty team has another argument to add to this: earnings estimates have been coming down and could be poised to come down further. Last September, analyst estimated that earnings growth for the fourth quarter of 2023 would come in around 7.9 percent. Now, with nearly three-quarters of S&P 500 companies having reported their Q4 numbers, those same analysts are forecasting just 2.8 percent growth when all is said and done. Looking ahead, the current estimate for the first quarter of 2024 is 3.8 percent growth, down from the previous estimate of 8.3 percent. Since earnings are the denominator of the P/E equation a decline in earnings will, all else being equal, increase the P/E number. That’s an argument in favor of “very expensive” and not just “expensive.”
It’s All Relative
Is that it, though? Take the case of high-flying Nvidia. The stock is up more than 40 percent so far just this year, and that’s in the context of a twelve-month price jump of 215 percent. The NTM P/E for Nvidia is 32.3 times, which sounds like a red flashing alarm, right? But if you compare Nvidia’s NTM P/E with that of the S&P 500 itself, it doesn’t look all that dramatic. On a relative basis, Nvidia’s P/E is actually close to its low point for the past five years. Yes, it trades at a premium of 1.6 times to the index, but that compares to more than 3.3 times early last year (and early last year would in hindsight have been a terrible time to ditch Nvidia, as some prominent growth fund managers did). The company’s sales and earnings – and this is also true for a number of the other tech leaders – have consistently grown in mid-double digits over this period as demand for the devices and services that power artificial intelligence has been seemingly bottomless.
So what’s the right answer? Take your pick. We think valuations are expensive enough to potentially constrain upside potential from another wild and crazy bout of multiple expansion, but we also think overall economic conditions are favorable enough to provide at least a modest tailwind to sales and earnings. It’s also possible that none of this will matter and the “vibes market” will find something else to latch onto, for better or worse, from whatever comes out of the opaque soup of narrative, commentary and fanciful conjecture. It’s that kind of a market these days. For us, though, we’ll continue to stick to the basics of free cash flow, sales growth profit margins and all those other boring artifacts.