On February 3rd the S&P 500 experienced its most severe pullback since the period from May 21 – June 24, 2012. Oddly, the magnitude of the pullback was exactly the same to within two decimal points: -5.76% in each case. Here at MVCM we use 5% as a marker for a pullback worth recording in our records of peak-to-trough movements going back to 1951. If the S&P 500 rallies by 5% or more without falling below the 2/4 close, then these Bobbsey Twins pullbacks will each merit a small, slightly amusing shout-out in the time-honored annals of Wall Street weirdness.
U.S. equities indexes may indeed bounce back for another rally, but we will not be surprised to see a return to more pullbacks, with greater magnitudes, than has been the case in recent years. The return of the periodic 10% correction, something we have not seen since 2011, is likelier to happen if something else comes back to the market that has been AWOL for a while: volatility.

Been Away For So Long
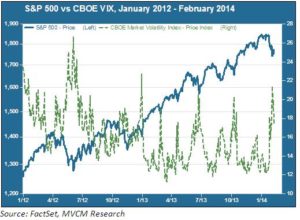
The above chart is something we have shared before with our Market Flash community: the volatility gap that has persisted almost without pause for the past two years. The CBOE VIX index, fondly referred to as the “fear gauge” by Street pros, had an average closing price of 14.2 in 2013 versus the long term average of 20.2 going back to the index’s inception in 1990 (a higher VIX price means more volatility). Even 2012, a relatively tame year with no 10%-plus corrections, had an average VIX level of 17.8. Those spectacular returns of 2013 came with relatively little risk.
In finance, as in other walks of life, what goes down eventually comes back up. Volatility will return; the question is whether that return is imminent or whether U.S. equities still have a couple big rallies left in them. We are increasingly of the opinion that the return will be sooner rather than later.
(Macro) Event Planning
One thing seems evident: we’re in one of those event-driven environments where meta-narratives rise organically out of the swamp of macroeconomic data points, corporate earnings releases and global goings-on in places like China, Turkey and Brazil. The meta-narrative of late has been decidedly negative. Emerging markets currency crises have prolonged the pain for investors with long exposure to what are looking less and less like the “growth engines” of several years ago. That in turn has concentrated attention on the greatest growth engine of all, China. Concerns have bubbled under the surface for several years now about whether the world’s second largest economy can pull off the feat of defusing a potential credit bubble while rebalancing its growth away from increasingly speculative investment towards a healthier level of domestic consumption. The numbers coming out of China always must be taken with a measure of skepticism; nonetheless, a China-centered shock would have the potential to scorch a wide swath of asset class terrain.
Still Not Cheap
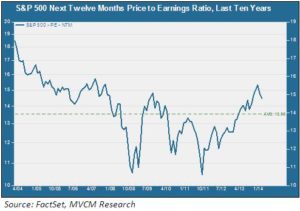
Meanwhile, the latest pullback has knocked about a point off the S&P 500’s next twelve months (NTM) P/E ratio, as seen below. But a pullback of a bit less than 6% doesn’t make for a screaming bargain when it comes on the back of a year of 30%-plus gains. At 14.4x, the NTM P/E is still above its 10-year average of 13.9x.
