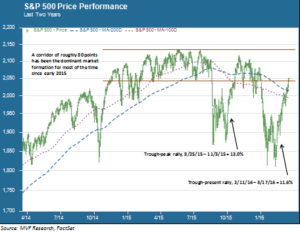
The punch bowl was not even half empty after Mario Draghi served up another round of stimulus last week, but Janet Yellen & Co. filled it right back to the brim on Wednesday and the party rolled on. The surprisingly dovish statement after this week’s FOMC meeting acknowledged what credit markets had already priced in: the cadence of rate hikes is going to be much gentler than December’s “dot plots” suggested. The brisk central bank tailwinds of late, along with a general absence of anything truly bad having happened for some time, have pushed the S&P 500 through some key resistance points. The index now finds itself…right back in the corridor where it has been for much of the past 15 months. The question for investors now is what it will take to push stocks through the corridor’s ceiling. We believe a sustained second leg of this rally will be considerably more difficult than the first.

Relief Rallies of a Feather
The two conspicuous banishments from the corridor share some characteristic patterns of intermittent bull market corrections: an initial steep drop followed by a sequence of tentative rallies and selling waves, and finally a double-digit relief rally to reclaim the lost ground. The chart above shows that the market finally kicked into gear in October 2015, rallying 13 percent back to the middle of the trading corridor. Similarly, shares recently have pushed up nearly 12 percent from their February 11 low point. The recovery has been fairly broad, as noted in some of our recent commentaries. Market breadth indicators like the advance-decline and 52 week high/low ratios are reasonably healthy. Higher risk areas like small caps and emerging markets are going gangbusters; to cite one example, Brazil’s Bovespa index is up 35 percent since its late January lows. That’s a bit surprising given that the economy is mired in a deep recession and the country’s political system is falling apart. Animal spirits and all that.
Given those animal spirits (and the auto-refilling central bank punch bowl), it is not hard to imagine that there is a bit more near-term upside for U.S. large caps. The S&P 500 is about 4.4 percent away from the all-time high it reached 301 days ago. Can it get there? Anything is possible, of course, but we imagine the headwinds are going to start getting stiffer if shares manage to get back to the middle of that corridor. That is when investors will have to start asking themselves whether this bull market still has room for another burst of the valuation multiple expansion we saw in 2013 and 2014.
The Valuation Ceiling
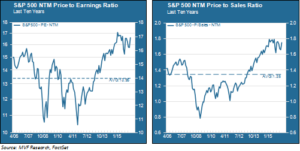
In 2013 stock prices soared, while earnings moved ahead at a more leisurely pace. Earnings per share on the S&P 500 advanced 5.6 percent that year, while share prices topped 30 percent for their giddiest year since 1996. Prices kept going up in 2014 and the first half of 2015, while earnings gradually tapered off and eventually turned negative. The chart below shows the 10 year trend for the next twelve months (NTM) price to earnings (P/E) and price to sales (P/S) ratios for the S&P 500.

Both the P/E and the P/S ratios remain considerably above their 10 year averages. Even at the low point of the recent correction the P/E ratio was only briefly below its pre-crisis 2007 high, while the P/S ratio didn’t even come close to approaching its 2007 levels. Now let us consider the outlook for the rest of this year. The most recent consensus outlook for Q1 2016 earnings per share according to FactSet is -7.9 percent, while the EPS outlook for the full year is 3.2 percent. Sales are expected to be slightly negative in Q1 and to grow by about 1.5 percent for the year. Now, it is plausible that sales could enjoy a light tailwind if the dollar continues to weaken in response to a more dovish Fed. And some recent price and wage data suggest at least the possibility of a brisker than expected pickup in consumer activity in the U.S. (though this data was largely downplayed by the Fed this week).
Even so, though, we see little to suggest that the cadence of EPS and sales growth will be strong enough to lift prices too far off their current levels without pushing the valuation metrics closer to bubble territory. For that to happen, we think we would need to see some random confluence of events acting as a catalyst for a melt-up. That’s not out of the question – melt-ups have served as the codas for previous multi-year bull markets. But predicting the timing of such a melt-up is a fool’s errand. Meanwhile, that valuation ceiling looks fairly imposing.