In the stock market, as in life, all is not equal. In the case of the S&P 500, the inequality derives from that simplest of mathematical formulas: share price times number of shares outstanding – i.e., market capitalization. The importance of any industry sector – from the standpoint of its influence on the total market – is simply a function of the market caps of all the companies in that sector added up. Simply put: the larger the market cap of an individual company or industry sector, the more impact their price movements have on the broader index.
Market Cap Economics 101
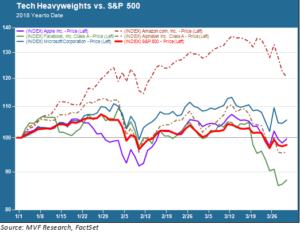
Investors have been getting a crash course in market cap economics over the past several weeks as the most dominant sector – and that sector’s most dominant constituents – have battled some unusually strong headwinds. Information technology – one of ten primary industry sectors in the S&P 500 – makes up just under 25 percent of that benchmark index’s total market cap. That is by far the largest single sector: financial institutions, the second largest, make up just 14.3 percent of total market cap at current values. Moreover, the four largest companies in the S&P 500 tech sector – Apple, Alphabet, Facebook and Microsoft – account for 11.1 percent of the total. Add in Amazon – widely considered a tech company although formally listed in the consumer discretionary sector – and you have five companies with a collective market cap of 14.1 percent of the S&P 500 – nearly as much as the entire financial sector. That explains why the following chart has so many investors on edge today:

Facebook, Unliked
The main tale of woe has centered around just one of these behemoths, Facebook, which is caught in the crosshairs of a rapidly evolving controversy over its data privacy policies. The story of Cambridge Analytica, a secretive data firm with an affinity for right wing politics and a 2016 mission to help get Trump elected, has been given thorough coverage in mainstream media outlets and does not need rehashing here. The issue is why this story, which at first glance would appear to be company-specific, has thrown such a wet blanket over the entire sector. As the chart above shows, the decline of the tech powerhouses in late January and early February was more or less in line with the market, while the sector’s decline in March has been relatively far more severe.
The answer is that, while Facebook has one business model, Alphabet (Google) another and Apple another still, issues like data privacy and network effects (which can potentially lock in users and lead to concerns about monopolistic practices) affect all the so-called “major platform companies.” In a sense, these recent developments are the flip side of the very reason for which investors have been in love with these companies for so long. Their platforms have radically changed the way a majority of Americans go about spending their days and nights. Actively managed investment funds, seeking that elusive (and probably illusory) “alpha” to beat the market, have swarmed into the so-called “FAANG” stocks like moths to a flame in the belief that these platforms are nearly impervious to competitive challenge.
Beware the Grim Regulator
If the tech heavies have in the recent past seemed like a free lunch, the recent travails are a reminder that free lunches don’t exist. Readers of US economic history know that the best laid plans of monopolists past have been dashed by regulatory push-back. It is by no means clear that a grim reaping is in store for the platform companies, but neither is it clear that they will continue to be given free reign to operate with no fundamental changes to their business models. As global companies, they are at the mercy not only of regulators at home, but arguably more antagonistic ones in the EU and elsewhere. It may be a stretch to imagine Facebook as a regulated utility (a theory which has surprisingly garnered considerable recent press coverage), but it’s worth remembering that strange things do sometimes happen.
In a practical sense, the uncertainty around tech adds a variable to the volatility equation that has become a constant companion in 2018. The CBOE VIX has not fallen below 15 since the original spike in early February, and currently hovers just around 20, the level considered to be a high-risk threshold. We’re seeing lots of those strange days when stock indexes spike up in morning trading and then plummet in the trading day’s final 30 minutes – signs of a jittery market with knee-jerk algorithms calling the shots.
Amid all of this, there is still little in the way of change to the dominant narrative of steady positive growth, a strong jobs market, solid corporate earnings and inflation kept in check. That may be sufficient to yet hold the downside in check. But those volatility variables, including the fog of uncertainty around that market cap-dominant tech sector, are keeping us very busy with our scenario analytics as the year’s second quarter beckons.