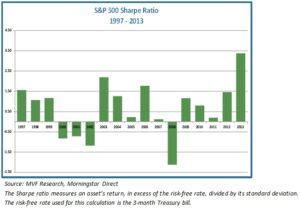
2013 was a very good year for U.S. equities. Even more impressive than the 32% total return on the S&P 500 was the very low level of risk that accompanied it. Based on the Sharpe ratio, a widely-used measure of risk-adjusted return, the S&P 500’s 2013 performance was in a class by itself, far outpacing even the heady days of the late-90s technology bubble (see chart below). In the world of investment performance measurement, a Sharpe ratio above 3.0 is just about as close as you can get to having your cake and eating it too. Is low volatility here to stay, or is this just an unusual period of calm before the next storm clouds appear?

Not Much Fear in the “Fear Gauge”
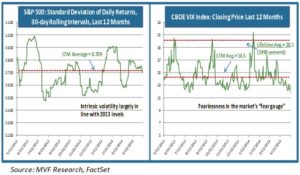
In 2014 to date there have been pockets of risk, notably in certain small cap growth sectors. But the story in the broader market hasn’t changed much: subdued baseline risk with a few intermittent spikes when unexpected X-factors briefly flash onto the radar screen. The following chart illustrates this story. On the leftmost side we show the standard deviation of daily S&P 500 returns over rolling 30-day intervals. The right side presents the daily closing price of the CBOE VIX index, which reflects a weighted average of puts and calls on the S&P 500 over a range of strike prices. Standard deviation provides a useful picture of intrinsic volatility, while the VIX gives us a good read on market perceptions of risk; for this reason it is popularly known as Wall Street’s “fear gauge”.

Stuck in the Corridor
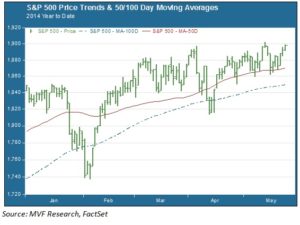
It is perhaps somewhat surprising to see this continuing pattern of low risk in the broad U.S. equity market. After last year’s big gains the market has mostly traded in a narrow and choppy corridor this year. Lack of direction can often mean heightened volatility. But apart from one brief spike during the late January pullback, the VIX has not even come close to breaching its lifetime average closing price of 20.1. Investors have largely taken in stride whatever the world has served up: from a harsh U.S. winter that impacted many corporate earnings results, to geopolitical turmoil in Ukraine, to a Eurozone flirting dangerously with price deflation. Support has been remarkably firm around intermediate moving averages, as the chart below illustrates.

Ready for a Breakout?
On the other side of the 50-day moving average support level, the index has several times bumped up against a psychological “round number resistance” point of 1900. At some point we would expect to see a directional trend form one way or the other; either a resurgent X-factor that brings back volatility and another pullback of 5% or more, or a continued rally driven by the meta-narrative of continuing benign economic data, double-digit 2H earnings growth and no new surprises from Ukraine, China or elsewhere. We need to be prepared for either outcome; that being said, the volatility signals are for the time being at least nowhere to be seen. “Sell in May” may not be a particularly helpful strategy this year.