
Meet Our Team

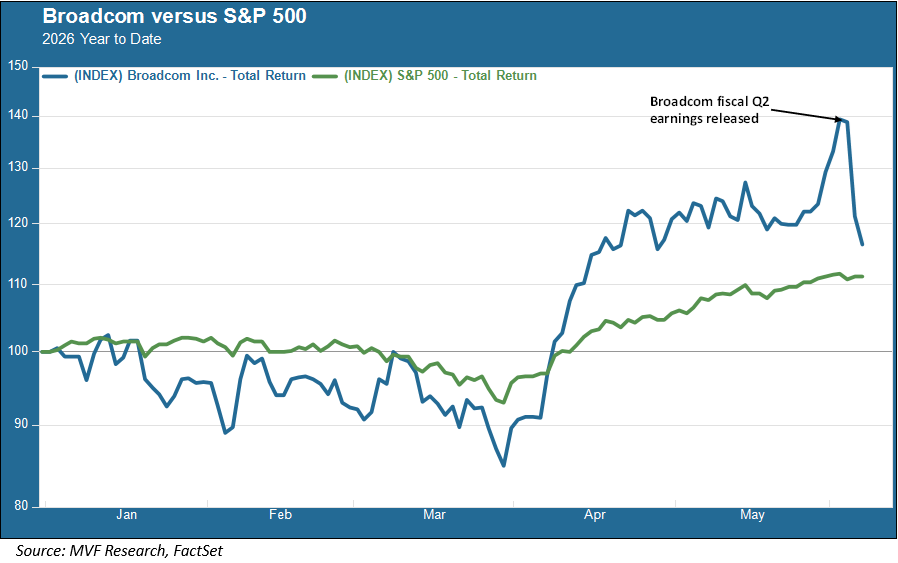
You would have needed a pole vault to get over that bar. The expectations bar, that is. On Wednesday after the market close, US chipmaker Broadcom released its sales and earnings report for the second quarter (second fiscal quarter, corresponding to the first calendar quarter ended March 31). Broadcom’s sales rose 48 percent year-on-year, and the company’s forward guidance for the quarter to come topped consensus estimates. The Palo Alto-based chipmaker is smack in the middle of the hottest story – arguably the only story – driving US stock market growth this year. Pretty good results, one might have thought.
But one would have been mistaken, at least in the context of what occupies the mind of the market. Broadcom shares plunged more than 12 percent yesterday, one of the biggest single-day losses on record, as investors apparently decided that even though the forward estimates beat the median forecast, they didn’t beat the most optimistic estimates. The freefall is continuing in the early hours of trading today, and the stock is now around 17 percent off where it started yesterday.
Here We Go Again with Productivity
The eye-popping magnitude of the Broadcom drop notwithstanding, the context around it is something we have seen time and again ever since OpenAI introduced ChatGPT to the world back in the latter months of 2022. Every now and then, the furious pace of investment in AI infrastructure and compute – the so-called “tokens” that are the basic units of AI brainpower – has been popped by a counternarrative questioning whether all this money was ever going to produce something genuinely productive and business-enhancing for its end users. There was a Goldman, Sachs research piece asking that exact question all the way back in the summer of 2023. Last year we had an MIT report in which 95 percent of companies using generative AI in some form claimed that their pilot programs were not delivering a clear financial return. And just last week, the chief operating officer of Uber introduced “tokenmaxxing” to the large swath of humanity unfamiliar with that term, noting that it was increasingly difficult to justify the amount being spent on AI tokens relative to their measurable effect on productivity. Just in time, perhaps, to frame the debate into which that hapless Broadcom earnings report came out this week.
Another False Rotation?
Whenever the AI counternarrative manages to score a hit against the dominant momentum, the inevitable question comes into play: to wit, is this now the moment when all the dishwater-dull laggards come out from behind the rocks and take charge? A look at recent history would suggest caution when debating whether to go pedal to the metal on any such rotation, because they have shown themselves to be short-lived. The chart below shows the performance of low-volatility versus high-beta (beta is a measure of relative volatility) stocks for the past 14 years, going back to the beginning of 2012 (the ETFs shown here were incepted in the middle of 2011). We think the high-beta / low-vol comparison is better for this purpose than, say, the old metric of value versus growth, because the AI trade has been pretty much entirely a high-beta story, while the waters are a bit muddier in the value / growth differential.
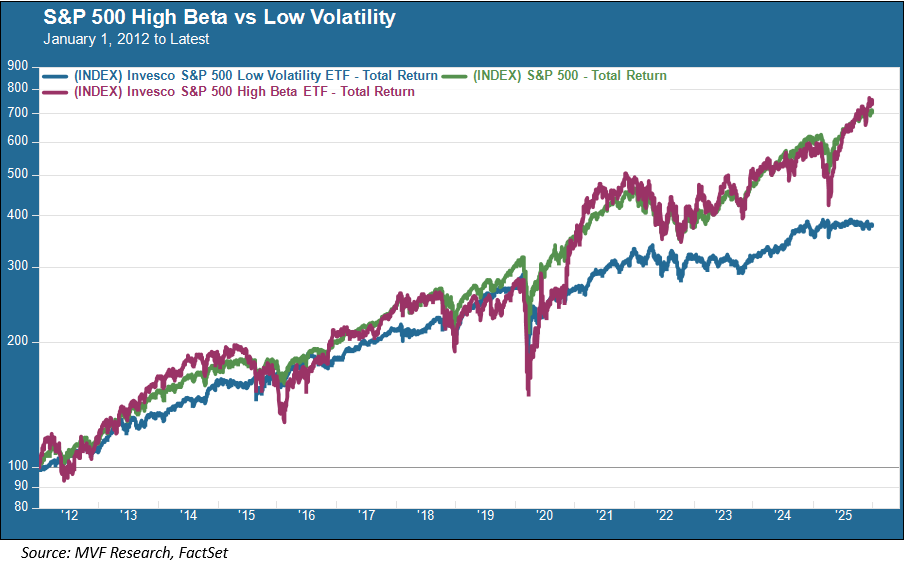
As the chart shows – and what should probably strike you as intuitive – is that in periods where things go sour, those high-beta stocks can fall much farther. A brief China shock in 2015, rising interest rates in 2018 and 2022, and the initial Covid shock in March 2020 all depict such periods. But the recovery from each downturn has tended to be quick, and over the entirety of the period the performance gap is notable, with the high-beta index returning nearly double its low-vol counterpart. Makes sense, right? Higher risk needed to obtain higher returns (though that Finance 101 tenet has always had its share of challengers, which is how “low volatility” offerings got to be a thing in the first place).
We will not be surprised if the stocks affected by the latest AI blowback turn around in the very near future, given that – tokenmaxxing chatter aside – there isn’t much evidence yet of any meaningful reversal to demand for all things infrastructure and compute. The buy-the-dip impulse among punters seems to be more frenetic than ever these days. But we will continue to take the counternarrative seriously, too, because it really still is an open question as to how all of this translates into measurable productivity. And we have some potentially major structural disruptions ahead, with both Anthropic and OpenAI on track to enter the public markets in the coming months. Not to mention the unwieldly behemoth SpaceX, about which we will no doubt have to share our opinions at some point in the not too distant future, whether we want to or not. In other words – both the narrative and the counternarrative are going to require close scrutiny in the weeks ahead.