
Meet Our Team

Patience and discipline. This is the mantra we have been encouraging our clients to embrace from day one. The past several weeks has constituted one of those times when following that mantra is exceptionally important. It is also exceptionally hard, because it requires control over our very powerful lizard brain impulses of fear and greed.
An Anthology of Disruption
Because it is hard to practice the art of patience and discipline when markets go pear-shaped, we pay very close attention to the facts around disruptive events. Specifically, we have documented every drawdown in the S&P 500 of five percent or more going all the way back to January of 1929. That’s 96 years’ worth of data. We are interested, not only in the magnitude of the drawdown, but what happens afterwards. One of the most common features of the post-trough recovery period is one or more days of very large gains shortly after the low point. This past week serves as a useful example of this tendency, which we show in the chart below.
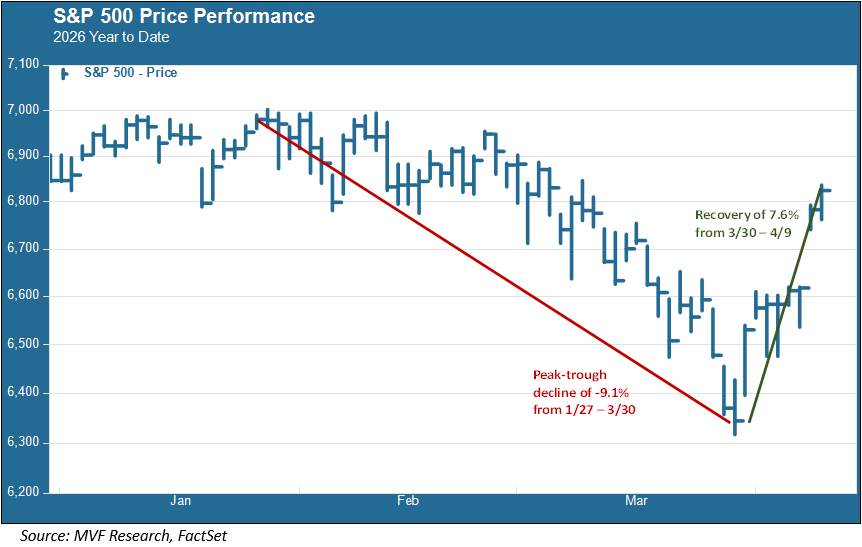
The S&P 500 reached its last record high on January 27. From there it declined by 9.1 percent to reach a low – thus far – on March 30. As you can see in the chart, much of the market’s recovery – a total of 7.6 percent from the March 30 low to the April 9 close – happened on two big up days: a gain of 2.9 percent on March 31 and one of 2.5 percent on April 8. Anyone who got out of the market sometime between January 27 and March 30 (probably closer to the latter, given how much of the drawdown has been driven by concerns over the war in the Middle East) and is still out has missed out on those up days. In the long run they matter – a lot.
Lessons from Liberation Day
Here is another specific example of why these up days matter so much. A year ago we experienced that stomach-churning event known as “Liberation Day,” when that preposterous chart showing how much the penguins on McDonald Island were going to have to pay the US government sent the market into a tailspin. That happened on April 2, 2025. Lizard brains went right to work, cranking up the fear factor and bailing out of the market. A week later, on April 9, Trump backed away from the tariffs and the S&P 500 jumped by 9.5 percent. In one day.
Here’s what that means for the longer term. The S&P 500 gained 37.4 percent from the post-Liberation Day low (on April 8) to the end of 2025. Now, let’s assume that Investor X got totally out of the market sometime between April 2 and April 8, and waited for a month before deciding that it was safe to come back in (say, for argument’s sake, on May 2). That investor’s gain from May 2 to December 31 would have bene just 20.4 percent. Not bad, of course, but still well below the 37.4 percent enjoyed by Investor Y, whose mastery of the patience and discipline mantra kept things on even keel during the chaos.
Ignorance Can Be Bliss
Of course, nobody has any idea ahead of time when these trough and recovery events are going to happen. That’s why we keep records of them – so that we can understand patterns and at least have a probabilistic argument to make for why it is better to stay invested through the rough patches. Every time the market falls by five percent or more, followed by a recovery of at least five percent, we record the drawdown-recovery as a discrete event. There have been 315 such “events” since the beginning of 1929. Over that same period there have been just 15 bear markets, defined by a structural downturn with a peak-trough decline of 20 percent or more. That is a perspective worth keeping in mind.
And even with the bear markets, staying disciplined is the better strategy. The second-worst market of this 96 year span occurred within the living memory of most of us – the global financial crisis of 2008 when the S&P 500 tumbled 56.8 percent from peak to trough. The recovery wasn’t pretty, but it happened. And within the first month after the March 6, 2009 trough, the S&P 500 registered one-day gains of two percent or more on seven occasions. Investors who got out during the mayhem paid the price for missing out on those up days.
Generally speaking, we are not fans of ignorance. But in the absence of a crystal ball to tell us when the market’s twists and turns are going to happen, it might not be the worst idea in the world to ignore the urge to time portfolio decisions around the imagined effects of market disruptions.