MV Weekly Market Flash: Jobs Disappoint, Market Gives Two Cheers
Read More From MVThe second half of the year is underway, and it’s beginning with the market doing a reprisal of one of its favorite schticks, the “bad news good” routine in which what’s bad for Main Street America is good for, well, the market and its myopic focus on whither interest rates. Recall that, following the Federal Open Market Committee’s meeting two weeks ago, the punters were penciling in September as the likely timing for a hike in the target Fed funds rate. Inflationary pressures, exacerbated by the ongoing war in the Middle East, had already taken a long-hoped for rate cut...
Read MoreMV Weekly Market Flash: The AI Story Mutates and Divides
Read More From MVLike any good complex organism, the AI narrative is splitting into multiple versions of itself, each reacting in different ways to the daily flow of information that feeds its life support systems. Time was when this was a simple, one-celled story. Buy AI! The collective wisdom of the market came up with a catchy name for the trade – the Magnificent Seven, mega-cap companies close enough to this emergent technology to be considered viable proxies. We were always a bit dubious about the logic underpinning the Mag 7. Nvidia – sure, its graphic processing units are essential for powering the...
Read MoreMV Weekly Market Flash: A New Sheriff at the Fed
Read More From MVAnyone who had been paying attention to the US monetary policy conversation in the past few weeks knew, within a very tight margin of error, what was actually going to happen at this week’s Federal Open Market Committee meeting. Nothing, as in, no change to the current Fed funds target rate range of 3.5 – 3.75 percent. Yes, but what was the new chairman of the Fed, Kevin Warsh, going to say about the decision to do nothing? What were the vibes going to be? How would this FOMC meeting be different from every other FOMC meeting? Well, we got...
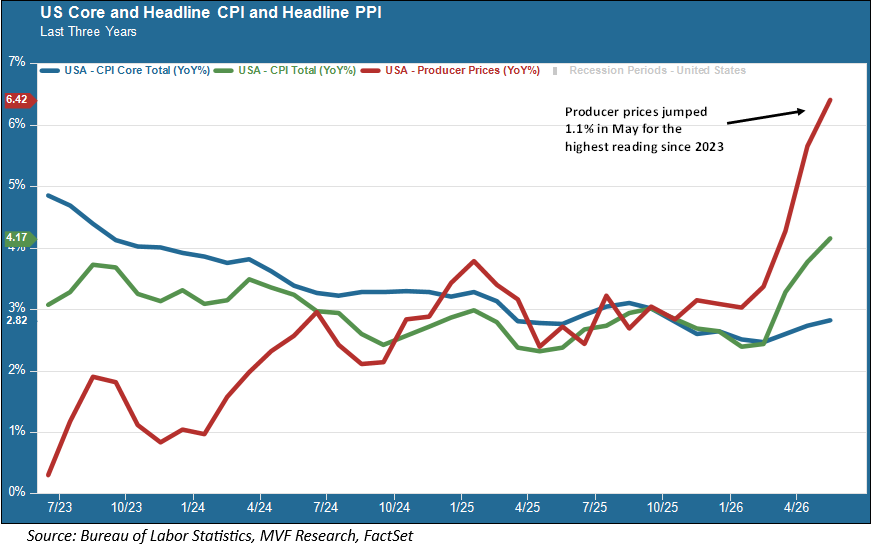
Read MoreMV Weekly Market Flash: Inflation and the Fed
Read More From MVAs of this past Wednesday’s market close, the S&P 500 had retreated by around 4.5 percent from its recent all-time high, set on June 2. The Nasdaq, home to a bevy of the AI-related names central to the market’s fortunes this year, had given up 7.1 percent from its most recent high water mark. There’s nothing particularly unusual about a drawdown of these magnitudes after a sustained run upwards. We make a note of every time the S&P 500 loses five percent or more followed by a recovery of at least that much, something which has happened 90 times since...
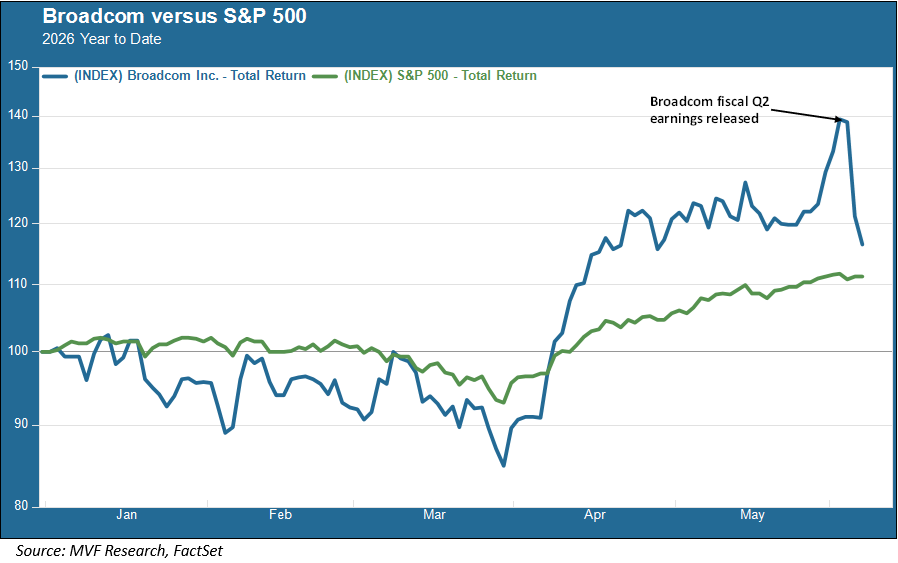
Read MoreMV Weekly Market Flash: The Performance Bar Gets Higher
Read More From MVYou would have needed a pole vault to get over that bar. The expectations bar, that is. On Wednesday after the market close, US chipmaker Broadcom released its sales and earnings report for the second quarter (second fiscal quarter, corresponding to the first calendar quarter ended March 31). Broadcom’s sales rose 48 percent year-on-year, and the company’s forward guidance for the quarter to come topped consensus estimates. The Palo Alto-based chipmaker is smack in the middle of the hottest story – arguably the only story – driving US stock market growth this year. Pretty good results, one might have thought....
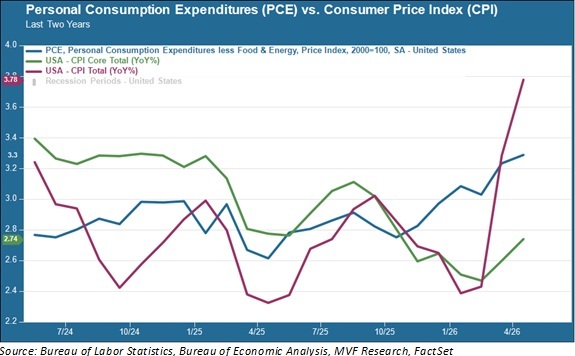
Read MoreMV Weekly Market Flash: Consumers Flash Some Warning Signs
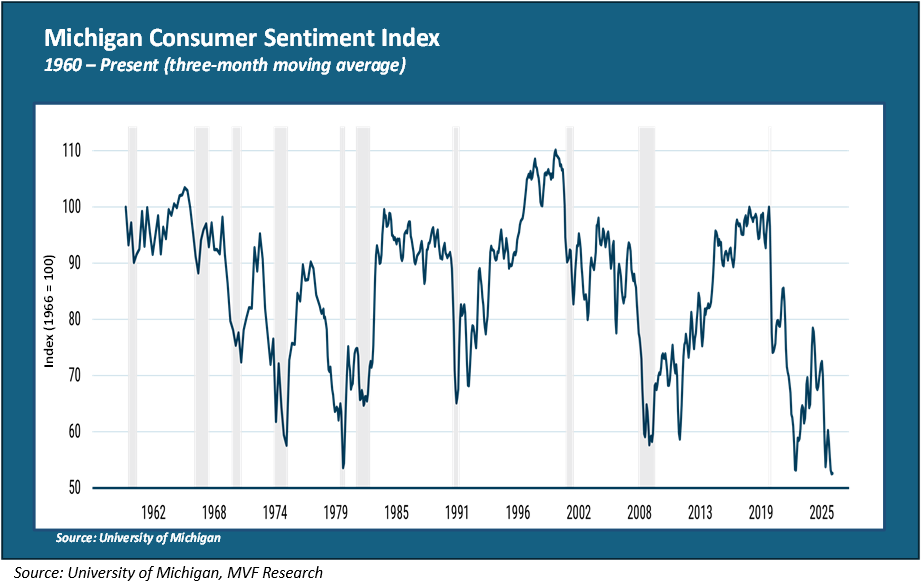
Read More From MVThe American consumer is the stuff of legend. Resiliently spending her way through the best and the worst of times, the consumer is the iconic emblem, the longstanding growth machine of the great US economy, accounting for nearly 70 percent of total gross domestic product year in and year out. Small wonder, then, that economists and other students of the market closely follow the minutiae of consumer data, from retail sales to personal consumption expenditures to household sentiment surveys. Struggling to Keep Up Many of these data points have been holding up better than expected recently. But there are some...
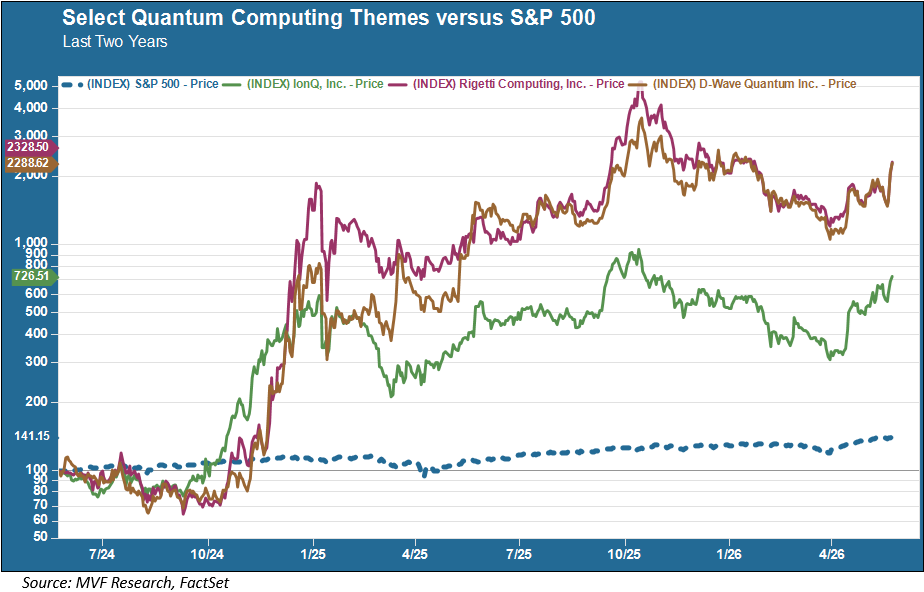
Read MoreMV Weekly Market Flash: Questions About Quantum
Read More From MVNobody understands quantum mechanics. That’s according to the late Richard Feynman, and as one of the greatest physicists of the twentieth century, he was in a good position to opine on the subject. As mind-bendingly counterintuitive as the subject is, though, it is showing up in all kinds of technological spaces these days. Including the stock market. The chart below shows the two-year performance of three companies engaged in various approaches to the challenge of developing a quantum computer: IonQ, Rigetti Computing and D-Wave Quantum. That blue dotted line plodding along below these three companies is the S&P 500. The...
Read MoreMV Weekly Market Flash: The Tribulations of Kevin Warsh
Read More From MVMay the odds be ever in your favor. That was the cynical sentiment expressed to those unfortunate souls selected for participation in the “Hunger Games,” the much-read and much-seen saga by author Suzanne Collins. With a 95.83 percent chance of death in that contest (23 out of 24), the odds were most definitely not in one’s favor. Now, Kevin Warsh did not come into his new post as chairman of the Federal Reserve through any “reaping,” as per the protocols of the Panem games in the fictitious series. This is, arguably, his dream job. Unfortunately for him, though, the state...
Read MoreMV Weekly Market Flash: Unruly Brittania
Read More From MVTen years ago, in 2016, it was Great Britain that fired the opening salvo in what would come to be recorded as a very disruptive year in global politics. The decision to leave the European Union took place that summer as British citizens stuck it to the man – if only by a couple percentage points – and buckled in for whatever might or might not happen next. YOLO, as the kids were still saying back then. A few months later, Americans likewise flipped off the Establishment as they handed Donald Trump a presidential victory over Hillary Clinton, the living...
Read MoreMV Weekly Market Flash: The Vibes Versus Reality Gap
Read More From MVIn the wonderful world of economic analysis we have hard data and soft data. These two things have been at odds with each other for some time, keeping those who try to supply insights and explanations about the data, ourselves included, asking why. We will try to come up with some answers as we delve into this topic today. Let’s establish some basic definitions. By hard data we mean the numbers associated with macroeconomic performance metrics, the big three of which are arguably growth (GDP), prices for goods and services (inflation), and the availability of jobs (payrolls and the unemployment...
Read More