MV Weekly Market Flash: Growth and Interest Rates
Read More From MVFor as long as we have been working in the financial industry, which comprises more decades than we care to let on, people have been worrying about debt and deficits. Throughout this time, though, investors the world over, institutional and individual alike, have been reliable buyers of US government debt. Deficit hawks, fretting over irresponsible Washington spending, turned out to be Cassandras endlessly predicting a financial apocalypse that never happened. But the debt continued to grow, and so did the size of the deficit. In the 1980s the federal deficit was typically somewhere around one to two percent of GDP;...
Read MoreMV Weekly Market Flash: Healthcare and the US Economy
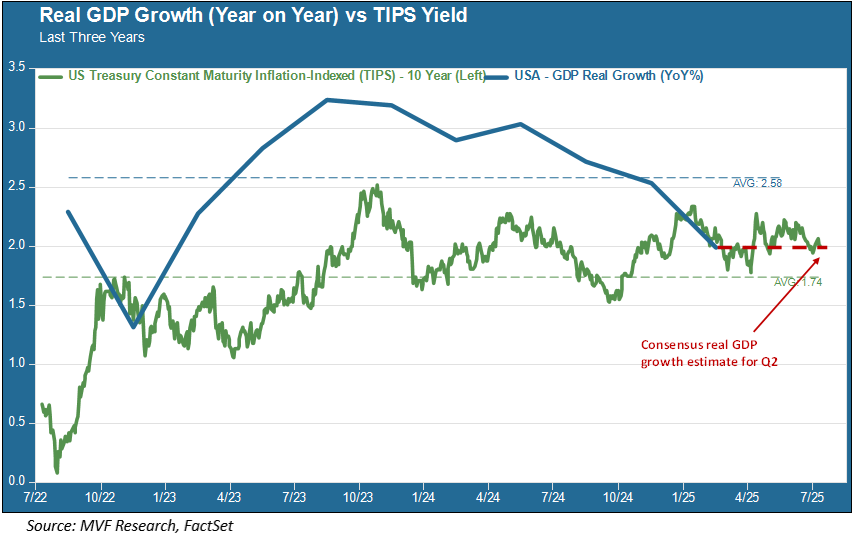
Read More From MVThe third quarter of 2025 is underway. So far, at least, it has seamlessly picked up the baton from Q2: quiet headline data that fails to make an impact on the Alfred E. Neuman (what, me worry?) market that we talked about in our commentary last week. Today, that headline data point is the monthly jobs report from the Bureau of Labor Statistics. Now, we might have expected this report to land on our desks with all the angst of an awkward middle schooler. Earlier this week a different jobs report, the ADP Employment Survey, showed a net loss in...
Read MoreMV Weekly Market Flash: Summer Breeze, and Markets Feel Fine
Read More From MVIf you had to put a human face to the performance of financial markets so far in 2025, to whom would that face bear a likeness? Ten weeks ago, a likely answer might have been Donald Trump, whose authorship of the most radical tariff ideas for the US since the Depression-era Smoot-Hawley Act was sending the stock and bond markets into alternating paroxysms of fear and relief. Six weeks ago the answer might have been Scott Bessent, the Treasury Secretary, whose measured comments and apparent ability to navigate a steady course through the crazy tweets and policy reversals provided a...
Read MoreMV Weekly Market Flash: Trouble Ahead, Says the Fed
Read More From MVRelative to how these things can sometimes go, the Federal Open Market Committee’s meeting this week was a bit of a nonevent for markets. The Fed was widely expected to keep interest rates where they have been since last September, with a Fed funds rate upper bound of 4.5 percent, and that is precisely what happened. The FOMC meeting concluded and the trading day ended with not much more than a shrug from the stock and bond markets. But below the headline takeaway of no change in rates, there was plenty to suggest that the central bankers are not particularly...
Read MoreMV Weekly Market Flash: Can the Markets Maintain Their Cool?
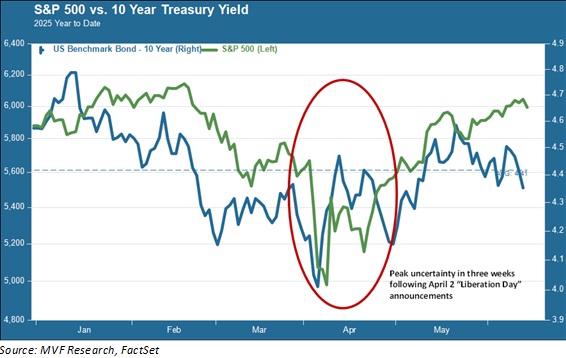
Read More From MVIf you exclude that three-week period in April when the most draconian tariff regime since the beginning of the twentieth century was announced and then promptly reversed (technically put on hold, but does anyone really believe that 46 percent tariffs are coming to Vietnam on July 2?), the first six months of 2025 have actually been pretty humdrum. The S&P 500 is up about two percent from where it was at the beginning of January, while the 10-year Treasury note is hovering right around its average yield of 4.4 percent for this period. Both stocks and bonds, in other words,...
Read MoreMV Weekly Market Flash: Harder Times for the Young and Educated
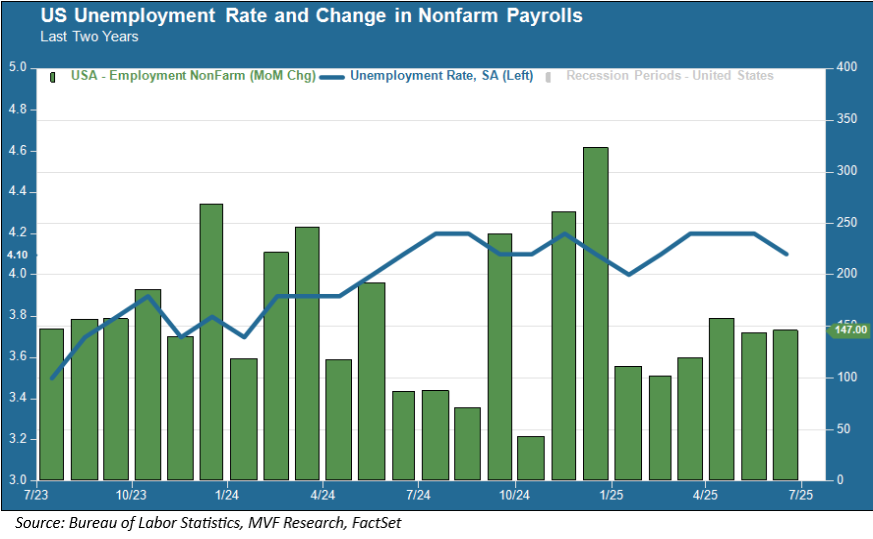
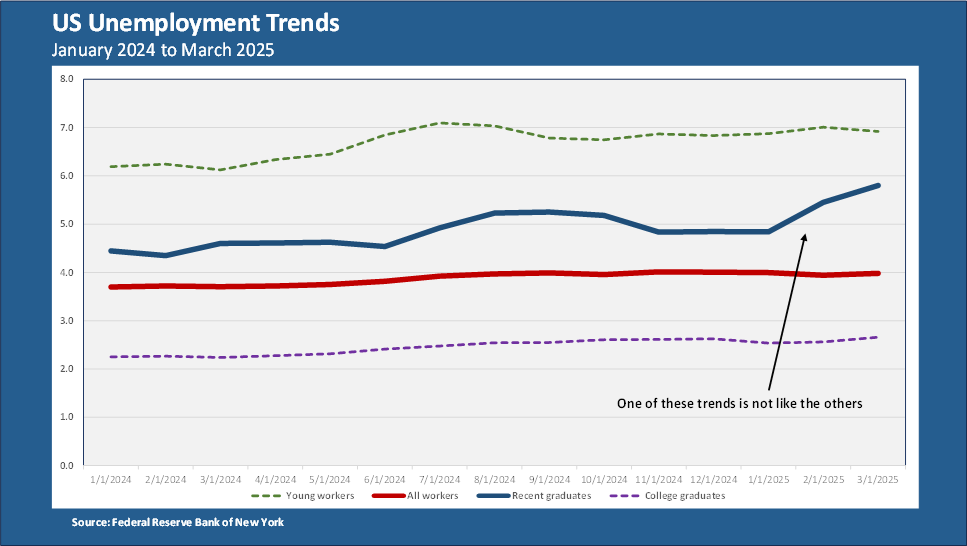
Read More From MVThis week was Jobs Week, when we were afforded a fresh look at employment trends in the US, and the net takeaway was the proverbial mixed bag. The headline number for Jobs Week, of course, is the monthly report from the Bureau of Labor Statistics which contains, among other data points, the national unemployment rate and the gains or losses in nonfarm payrolls. That report, which came out this morning, showed a continuation of slowing payroll gains, the fifth month in a row in which payroll additions grew at a slower pace than the three-year average of 213,000. The overall...
Read MoreMV Weekly Market Flash: If Not One Thing, Then Another
Read More From MVKeeping up with the financial news is a tall order in this Year 2025 of the Common Era, which will almost certainly enter the logbooks of history as the Year of Uncertainty. Consider the week that is ending today. It started off, well, just fine, as far as things go these days. Those nasty 50 percent tariffs on goods imported from the European Union that the administration had announced just last Friday were, surprise of all surprises, delayed from a June 2 commencement to July 9. That nice little Memorial Day weekend treat got markets off on solid footing as...
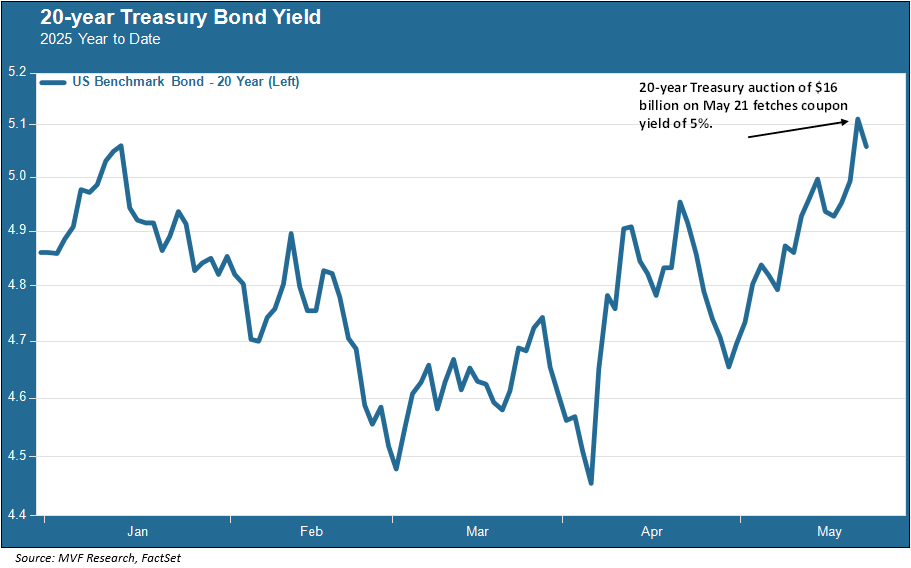
Read MoreMV Weekly Market Flash: Triple-B Problems in the Debt Market
Read More From MVSometimes the wry humor just writes itself. This week saw the House pass a tax bill going by the name “one big beautiful bill” – or “Triple-B”, as some of the Republican House staffers would refer to it in their back-and-forth messaging during the sausage-making process. Bond investors, always happy to latch onto a joke at some else’s expense, piled onto the Triple-B moniker – BBB, of course, is the lowest rung on the investment grade credit scale before descending into the funhouse of junk bond ratings. As in: that’s where American government debt – the world’s long-enduring proxy for...
Read MoreMV Weekly Market Flash: Data Distortions and the Spirit of 2020
Read More From MVEvery calendar quarter, we publish a survey of markets and the economy for our clients called the “State of Play.” One of the standard features of this quarterly report is a time series snapshot of four headline macroeconomic trends over the past five years. The significance of this span of time is that it was exactly five years ago when the economic shutdown forced by the global pandemic threw a spanner into our neat little set of trendlines for employment, GDP growth and the like. Suddenly, those incremental month-to-month and quarter-to-quarter changes were disrupted by the most seismic shifts on...
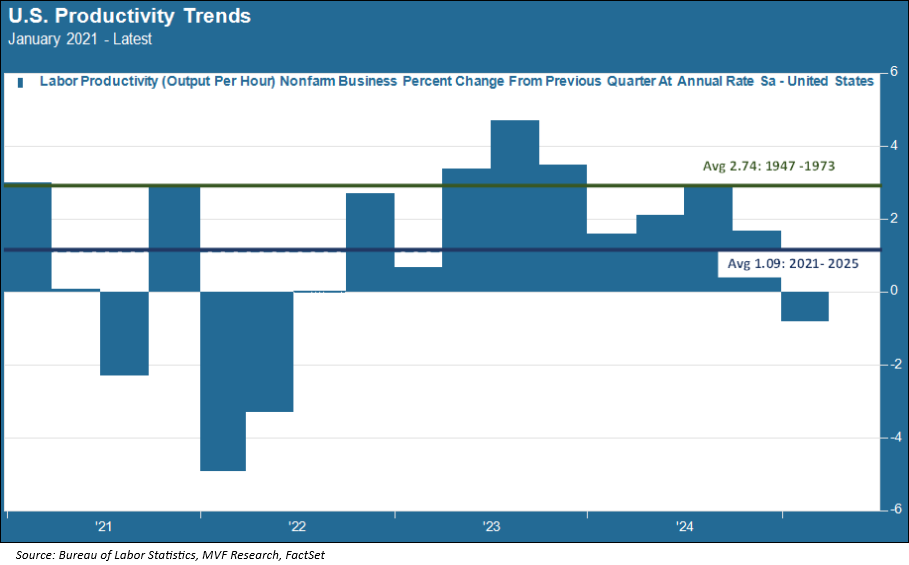
Read MoreMV Weekly Market Flash: Productivity and the Growth Question
Read More From MVWe sometimes refer to productivity as “the most important macroeconomic data point that nobody pays attention to.” That’s in contrast to the holy trinity of jobs, inflation and GDP growth, the three reports that generate the most chatter among financial media types. The productivity report for the first quarter came out yesterday, but unless you were deep into the economics pages of the Financial Times or the Wall Street Journal, its coming and going would have passed you by. That’s a pity, because in the long run our economic prosperity depends on growth, and in our demographically challenged times, the...
Read More