MV Weekly Market Flash: More Questions Than Answers in the Jobs Market
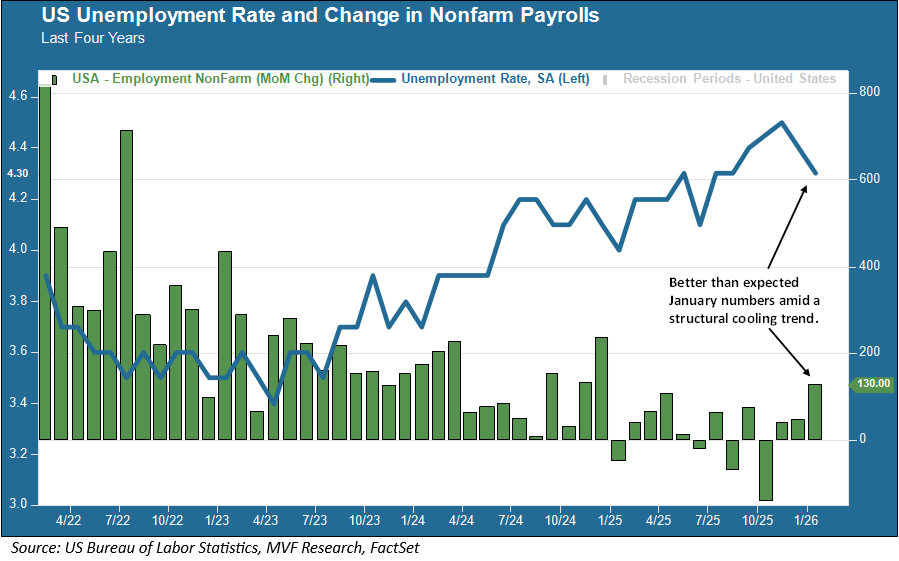
Read More From MVWhat’s going on in the US jobs market? Over the past couple weeks, we have received a deluge of data points about job openings, layoffs, payroll gains and – the one most people think of when someone says “labor market” – the benchmark unemployment rate. What this truckload of data has not done, though, is offer a clear picture of the current state of the labor market. Oh, and then there is one more data point, which is the tanking stock prices of a whole bunch of companies that was the subject of our commentary last week and which has...
Read MoreMV Weekly Market Flash: The Everything Pullback
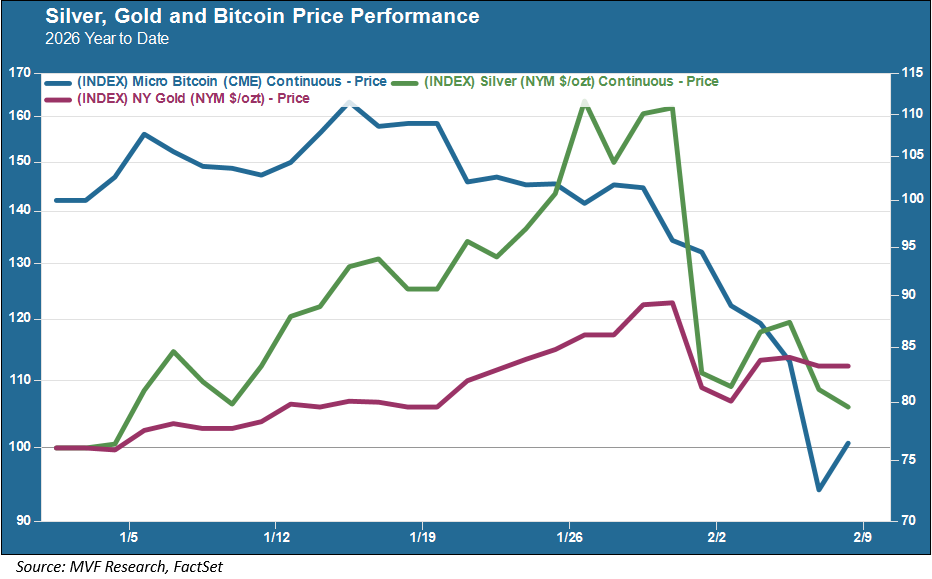
Read More From MVSilver and gold, silver and gold, sang Burl Ives as the Claymation snowman Sam in Rudolph the Red-Nosed Reindeer (apologies, sort of, for the earworm). Anyone who bought silver and/or gold a couple weeks ago is probably not singing a merry tune this week, as the price of these precious metals commenced a precipitous plummet last Friday that has continued into this week. The gold bugs can at least take comfort in the fact that they’re not alone. A wide swath of folks from crypto enthusiasts to lovers of software-as-a-service companies and hyperscale AI titans are feeling an unusual amount...
Read MoreMV Weekly Market Flash: A Drama-Free Week at the Eccles Building
Read More From MVIt is something of a rarity when a single week contains both a policy meeting by the Federal Open Market Committee and the announcement of a selection for the next Fed chair – and that same week winds up being one of the most boring and least drama-filled in recent memory. After weeks of theatrics around the current dramatis personae of the Fed and their interest rate decisions or their office renovations or the minutiae of their personal mortgage applications, with page after page of financial media op-eds breathlessly debating the existential precariousness of an independent central bank and its...
Read MoreMV Weekly Market Flash: Polymarket for the Polycrisis
Read More From MVImagine if they had Polymarket and Kalshi 150 years ago. What a time the speculators of the day would have had! In 1876, major disturbances broke out all over the Balkans as people rose up, in a generally sporadic and uncoordinated fashion, against their nominal overlords running the Ottoman Empire. An uprising in Bulgaria was particularly brutal as a small band of nationalists was crushed by Ottoman troops and massacred in grisly fashion. These disturbances worried the Great Powers of the day, with Russia and newly-united Germany in particular swooping in to either try and restore order or grab a...
Read More2026: The Year Ahead
Read More From 2026:Many things in the world changed in 2025, in some very profound ways and with very uncertain possible outcomes. Prominent among the things that didn’t change much, though, were financial markets and the global economy in general. That was something of a surprise, given the volatility we experienced during the late first and early second quarters of the year. But the volatility settled down. The direction of the economy pointed up, as did the path of risk assets. Bond yields were for the most part pliant during the second half of the year. Companies made plenty of money, and a...
Read MoreMV Weekly Market Flash: It’s More Complicated Than Mag Seven
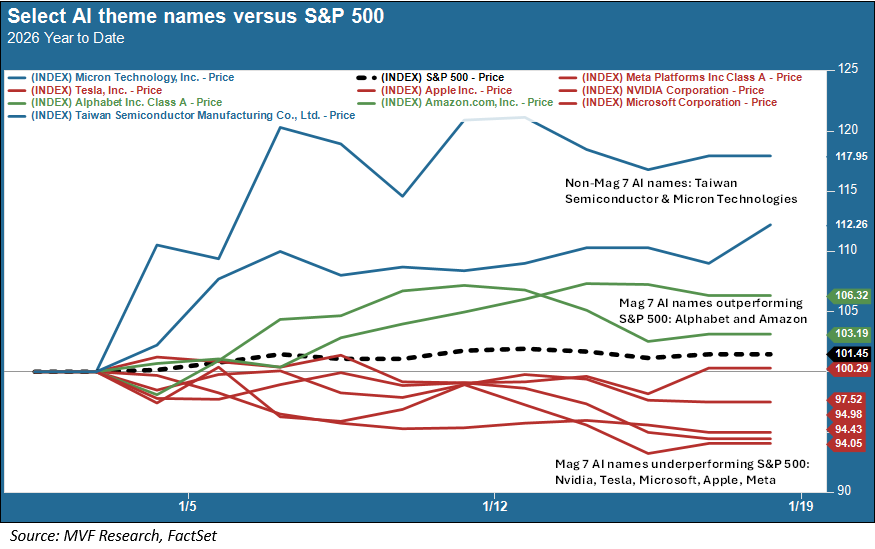
Read More From MVSince we are now sixteen days into Year 2026 of the Common Era, it is once again time for everyone in the financial field to make bold pronouncements about the Great Rotation that is to January what the Great Pumpkin of Peanuts fame is to October (i.e., the wild imagining of an impressionable mind). It’s true that small cap and value stocks have done comparatively well in this year’s early days. And as of this morning five of the fabled “Magnificent Seven” stocks that for the past three years have served as an easy market shorthand for “AI leaders” are...
Read MoreMV Weekly Market Flash: Five Things That May Matter in 2026
Read More From MVRegular readers of our weekly column will know that we put very little stock in the flood of predictions made by investment houses large and small as the New Year gets under way. Who knows where the S&P 500 or the MSCI All World Index will be eleven and a half months from now? Not us, not the heads of Wall Street bulge bracket banks, not the Fed chair or the economics departments of Harvard or MIT. All manner of things are going to happen, in our country and the world at large, between now and December 31. All we...
Read MoreMV Weekly Market Flash: Yet Another Year of Economic Resilience
Read More From MVWell, here we are. 2025 is coming to an end and we have somehow made it through. Yay! There are plenty of things we could dwell on as standout themes for the year gone by, but the one that looms largest in our minds is – not for the first time and probably not for the last time – the resilience of the global economy. Let’s look at some of the ways we managed to survive the year, economically speaking, when there was so much change afoot. Ghosts of the 1930s Two senators of a bygone era became a big...
Read MoreMV Weekly Market Flash: Economy Grows, Consumers Unimpressed
Read More From MVSometime earlier this year we wrote about the disconnect between so-called “hard” and “soft” economic data. Hard data points include the headline numbers of inflation, unemployment and GDP growth, while the concept of soft data refers to surveys about how different cohorts in the economy – households, small businesses and the like – feel about the current situation and their near-term prospects. When we wrote about this during the first quarter of 2025, the disconnect was reflected as negative sentiments expressed in the “soft” surveys while the “hard” macro numbers seemed to validate an economy that was still performing relatively...
Read MoreMV Weekly Market Flash: The Chorus of the Bulls
Read More From MVThe latest Global Fund Manager Survey published by the Bank of America is out. The survey canvasses the opinions from 238 institutional fund managers, collectively managing around $364 billion, on a wide spectrum of issues around the economy and financial markets. The tenor is pretty upbeat. Well, very upbeat, actually. The sentiment indicator – a broad measure of expectations about economic growth and equity market performance – is the highest it has been since July 2021. What to Expect When the Market Expects Bulls That sounds nice, perhaps. Fund managers (for reasons we do not entirely share) are happy with...
Read More