Meet Our Team
MV Weekly Market Flash: More Treats Than Tricks
MV Weekly Market Flash: The Tailwinds of September
MV Weekly Market Flash: What To Expect When You’re Expecting a Rate Cut
MV Weekly Market Flash: China In 3D
MV Weekly Market Flash: September, True to Form
MV Weekly Market Flash: The De-Inversion Cometh. What Next?
MV Weekly Market Flash: If It’s Late August, It Must Be Jackson Hole
MV Weekly Market Flash: Apocalypse Not
MV Weekly Market Flash: Notes From A Weird Week
MVF Special Update: 08/06/2024

MV Weekly Market Flash: More Treats Than Tricks

Read More From MV

It is supposed to be the month of March that comes in like a lion, out like a lamb, according to the custodians of timeless wisdom. This year, though, that appellation could just as well apply to September. After a volatile beginning, financial markets settled down and more or less calmly navigated the twists and turns of the daily news cycles. At the end of it all, the S&P 500 posted a gain of just over two percent from the beginning to the end of the year’s ninth month – not a shabby chunk of change. So how is the...

Read More

MV Weekly Market Flash: The Tailwinds of September

Read More From MV

As we noted in one of our commentaries earlier this month, September has a history of bad vibes for equity markets. For a while there, it seemed like this was going to be one of those glass-half-empty years with sagging share prices and lots of volatility. But, as we also observed in that earlier commentary, every September has its own story. In the end, this year has been the story of three tailwinds that combined to take the edge off seasonal negativity and deliver unto us a pleasantly sustainable rally through the second half of the month. The Return of...

Read More

MV Weekly Market Flash: What To Expect When You’re Expecting a Rate Cut

Read More From MV

Well, in the end they went big. The Fed cut the Fed funds target rate by 0.50 percent, and for maybe the first time in this entire monetary policy cycle, the bond market got it right (futures markets had priced in about a two-thirds probability of a jumbo cut versus the more usual 0.25 percent increment). The stock market seems to be trying to sort out all manner of mixed emotions – closing down after bouncing around in the immediate wake of the announcement on Wednesday, then staging a rally for the ages yesterday, and back into a bit of...

Read More

MV Weekly Market Flash: China In 3D

Read More From MV

Demography, deflation and debt. These are the Three Ds of China’s economic lassitude, and they have all been in the news recently. International investors, meanwhile, continue to add a fourth D to the picture – departure. The Shenzhen A shares index, a bellwether of mainland Chinese equities, is down 32 percent from its 2-year high set in February of last year. And it’s not just portfolio managers with their fleet-of-foot capital heading for the exits; US and European businesses with longstanding foreign direct investment in China are rethinking the dependence of their supply chains on a China that has become...

Read More

MV Weekly Market Flash: September, True to Form

Read More From MV

You may have noticed that markets have been a tad jittery lately. The S&P 500 is down around 2.6 percent from the beginning of the month, and about 2.9 percent off its last record high set on July 16. There are lots of plausible explanations out there in the crossroads and roundabouts of financial media chatter. Uncertainty about the upcoming election, fears of a potential recession, doubts about whether the Fed is moving fast enough on interest rate cuts – all of these and many more fill up the pages of the Wall Street Journal and the talking heads panels...

Read More

MV Weekly Market Flash: The De-Inversion Cometh. What Next?

Read More From MV

Thursday morning opened the same way every morning has opened since July 5, 2022 – with the Treasury yield curve inverted at the 2-year and 10-year maturities. That’s 786 consecutive days (counting weekends and holidays) of an inverted curve, the longest on record by far (the previous record was 624 days in 1978). But on Thursday, the difference between the two maturities was a scant three basis points, or 0.03 percent, suggesting that the end of this magnificent streak is fast approaching. Since an inverted yield curve is supposed to be a reliable harbinger of a recession, enquiring minds want...

Read More

MV Weekly Market Flash: If It’s Late August, It Must Be Jackson Hole

Read More From MV

Late August means different things to different people. The last chance for a relaxing week at the beach before the new school year begins. Putting up the college flag on the front lawn in anticipation of the upcoming football season. Endless variations on recipes for those fresh tomatoes, straight from the garden. And for finance nerds like ourselves who closely follow the twists and turns of monetary policy, it’s Jackson Hole time. At their annual gathering in the shadow of the majestic Grand Tetons of Wyoming, the world’s leading central bankers pair cowboy hats with their sober business suits and...
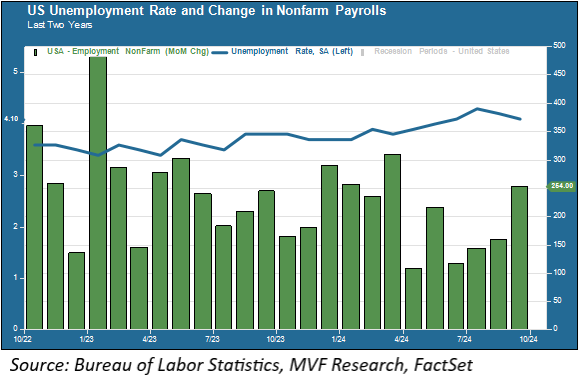
Read More

MV Weekly Market Flash: Apocalypse Not

Read More From MV

Two weeks ago to the day, a soft jobs report sent risk asset markets into a tizzy. The report from the Bureau of Labor Statistics on August 2 seemed in investors’ minds to validate two data points from earlier that week, one a survey on manufacturing activity and the other a weekly tally of new filings for unemployment, suggesting that the economy was slowing at a faster than expected clip and could be in recession by the end of the year. Bearish sentiment ticked up. Investors bought lots of Japanese yen because that’s one of the things people do when...

Read More

MV Weekly Market Flash: Notes From A Weird Week

Read More From MV

It’s been a minute, as they say. What to make of it all? Let’s start with that first bit of news to which we all woke up on Monday morning, namely a 12 percent drop in the Nikkei 225 benchmark index of Japanese stocks. That one-day plunge had those of us who were around and following markets in October 1987 reminiscing, and not necessarily in a good way. It’s worth noting that Monday’s percentage loss was twice the magnitude of the six percent drop in the Nikkei immediately following the earthquake in 2011 that produced a meltdown in the Fukushima...

Read More

MVF Special Update: 08/06/2024

Read More From MVF

To Our Valued Clients: As you are no doubt aware, there has been a considerable amount of volatility in global investment markets over the past several days. While we endeavor to keep you informed about important market developments on a weekly basis every Friday, we thought that the unusual amount of choppiness, along with some at times (in our opinion) overblown chatter in financial media outlets, merited a special comment a few days ahead of our regular Friday commentary. The key point we want to emphasize here it that yesterday’s big pullback, with the S&P 500 declining by 3.0 percent...

Read More

MV Weekly Market Flash: More Treats Than Tricks

It is supposed to be the month of March that comes in like a lion, out like a lamb, according to the custodians of timeless wisdom. This year, though, that appellation could just as well apply to September. After a volatile beginning, financial markets settled down and more or less calmly navigated the twists and turns of the daily news cycles. At the end of it all, the S&P 500 posted a gain of just over two percent from the beginning to the end of the year’s ninth month – not a shabby chunk of change.

So how is the final stretch of the year shaping up? Well, we’re barely a week into the fourth quarter, but there are a few reasons why it might make sense to move the arrow a bit more in the direction of the bull and away from the bear.

Jobs Mojo

Remember the market’s big freakout back in August, as a handful of jobs numbers raised fears among some observers that a recession was just around the corner? Well, those fears seem to have largely dissipated into the ether. We had more jobs data this week – from a job openings report on Tuesday to a survey by ADP on Wednesday and then the monthly employment report from the Bureau of Labor Statistics this morning – all coming in ahead of economists’ forecasts with a particularly strong showing in nonfarm payroll additions in today’s BLS report.

Oh, and in addition to the 254,000 increase in nonfarm payrolls this month, the BLS also revised up by 55,000 the July NFP number. So that 89,000 payroll gains figure that everyone was so distraught about is now a haler 144,000 (the August nonfarm payroll number also was revised up by 17,000). Moreover, the unemployment rate for September ticked down a bit to 4.1 percent. As the above chart shows, the labor market picture looks remarkably stable over the past two years, with a slight cooling from last year’s torrid pace, but nothing that resembles a downward spiral into recession territory. As always, we apply a note of caution when looking at data from a single point in time. The trend, though, does not make a compelling argument for approaching turbulence.

A Strike Averted

A second potential near-term concern fizzled out in this morning’s news dump when we learned that the strike begun by the International Longshoremen’s Association earlier this week, threatening a protracted shutdown of US ports just in time for the holiday season, was called off thanks to a partial agreement reached between the unions and the port operators. The strike, about to enter its fourth day, could have caused billions of dollars of damage to the US economy – a JPMorgan report suggested the economy could lose around $4.5 billion for each day of the strike. Not to mention the political implications, as the non-arrival of Amazon packages could have people in a less than festive mood as they mail in their ballots or head to the polls on November 5. The current agreement extends union members’ contracts until January 15 (with an eye-popping 62 percent increase in wages already agreed to), so at least that will get us through the holidays.

Election a Non-event for Markets?

There has been a lot of talk throughout the year (and more than our fair share of chats with nervous clients) about the potential impact of the upcoming election on markets. We’re about a month away from the event itself, but we really are not seeing much in the way of market jitters with any identifiable connection to the election. If you are inclined to believe the polls, the presidential race is nearly entirely within the margin of error, and thus essentially a coin toss come Election Day if momentum has not moved significantly one way or the other by then. Of course, the polls are not perfect oracles, and this year in particular it may be difficult to accurately model what the electorate of actual voters is going to look like.

Beyond the race for the top job, of course, there are also the consequential outcomes of the House and Senate that will figure directly into whatever prognostications one might make about the formation of economic policy next year. So rather than worry about something with too many variables at play, the market’s attitude would seem to be indifference. Que sera, sera. Of course, October is only four days old, and there still may be some nasty tricks out there, somewhere. For now, though, we’ll take the treats of good jobs numbers and open East Coast ports.

MV Weekly Market Flash: The Tailwinds of September

As we noted in one of our commentaries earlier this month, September has a history of bad vibes for equity markets. For a while there, it seemed like this was going to be one of those glass-half-empty years with sagging share prices and lots of volatility. But, as we also observed in that earlier commentary, every September has its own story. In the end, this year has been the story of three tailwinds that combined to take the edge off seasonal negativity and deliver unto us a pleasantly sustainable rally through the second half of the month.

The Return of AI

The first tailwind might not have been expected back in those early, volatile September days. As the final days of August ticked down, leading AI chipmaker Nvidia reported sales and earnings that, notwithstanding triple digit growth at both the top line and bottom line, disappointed the sell-side analysts who walked away from that earnings call apparently convinced that all the chatter about the “end of AI” was right, that the glory days of this narrative were over. Shares in Nvidia and other prominent AI-related names outpaced overall market declines in that first nasty week of September.

Sometimes, though, hard data wins out over Mr. Market’s fuzzy feelings. A series of subsequent earnings reports seemed to suggest that demand for AI-related products and services was not abating at all (which, in fact, one could have surmised from the Nvidia report itself with the 122 percent year-on-year sales growth). The turn towards a glass-half-full read on things got further validation this week when leading memory chipmaker Micron Technologies reported its sales and earnings, exceeding forecasts and raising its forward guidance largely due to robust demand for its AI-related products.

Easing Everywhere

The second tailwind arrived on September 18 courtesy of Jay Powell and his colleagues on the Federal Open Market Committee, in the form of a jumbo rate cut. For once (as we noted in our commentary last week) the bond market got it right and the cut came in at 0.5 percent rather than the usual 0.25 percent. We’re in a world of rate cuts now, not just here in the US but in the Eurozone and, probably soon, the UK. Inflation continues to trend lower. Today’s PCE report, which is the Fed’s preferred inflation metric, showed headline prices returning to just a 2.2 percent increase year-over-year, while the more consequential (for the Fed) core PCE number grew just 0.13 percent in August (lower than economists’ expectations) and 2.7 percent from the same month last year.

The jumbo rate cut was a statement that, with a high level of confidence in the deceleration trend of inflation, the Fed can focus on measures to support labor market conditions. The market has been very attentive to jobs data in determining the likelihood of achieving, for once and for all, that hoped for soft landing. At least for now, most of the data we are seeing continue to support that outcome as a base case assumption. We are starting to see indications from retailers that suggest a strong season for holiday spending, which would provide further assurance that a downturn is not in the immediate future.

China Joins the Fun

It is not clear what finally pushed Chinese economic policymakers to unleash a blizzard of stimulus measures aimed at pulling the economy out of its longstanding funk, but they finally managed to put together a package bold enough to capture investors’ attention. Now, as we have observed on a number of occasions on these pages, China has some serious structural problems with its domestic economy that will take more than the conventional tools of monetary policy to solve. The measures announced by Beijing this week, including reductions in benchmark interest rates, cuts to reserve requirements and easing of medium-term lending facilities (which can have a direct positive effect on mortgage prices) are likely to fall short of the scope needed to provide long-term structural solutions to the beleaguered current rate of household spending.

But what really caused heads to turn in the capital markets was the announcement of a war chest of around $114 billion for the sole purpose of supporting domestic asset markets. That money would be funneled into the financial system to buy shares of Chinese companies. Little wonder, then, that the CSI 300 index, a benchmark comprised of companies trading on the Shanghai and Shenzhen exchanges, soared more than 15 percent this week. The happy talk in China reverberated to share exchanges in Europe and the US, where companies with significant China exposure got an extra boost in an already-good week.

As always, we have to keep an eye on what’s next, and what could throw another wet blanket on the positive sentiments of the moment. For now, though, we’ll take a September that ends in positive territory as a win. Let the tailwinds blow.

MV Weekly Market Flash: What To Expect When You’re Expecting a Rate Cut

Well, in the end they went big. The Fed cut the Fed funds target rate by 0.50 percent, and for maybe the first time in this entire monetary policy cycle, the bond market got it right (futures markets had priced in about a two-thirds probability of a jumbo cut versus the more usual 0.25 percent increment). The stock market seems to be trying to sort out all manner of mixed emotions – closing down after bouncing around in the immediate wake of the announcement on Wednesday, then staging a rally for the ages yesterday, and back into a bit of an edgy pause in pre-market futures trading this morning. Naturally, the financial news channels are saturated with furrowed-brow panelists telling their viewers what will happen next. Do any of us know what to expect? Let’s consider the fairly scant supply of data from (relatively recent) past events from which one might venture to make a prognostication.

Sample Size Equals Small

The chart below shows the history of the Fed funds target rate going back to the beginning of 1984, 40-plus years ago, along with the price performance of the S&P 500. During this period there were five rate cut cycles of meaningful magnitude, four of which coincided with an economic recession.

As you can see from the chart, the answer to the question “what can we expect?” over the course of a sustained monetary easing cycle would aptly be: “just about anything.” The one easing cycle that did not coincide with a recession – between 1984 and 1986 – delivered a nice cumulative return of close to 40 percent over the roughly two year duration of the cycle. The cycle that followed, which encompassed the 1990 recession, produced a somewhat more modest but still decent stock market return of around 35 percent over its duration of three and a half years.

Each of the next two easing cycles had a different story to tell. The Fed started to lower interest rates about ten months after the S&P 500 hit its tech bubble peak in March 2000. This easing cycle coincided with what was then the largest peak-trough decline in the US stock market since the end of the Second World War. Four years after that easing cycle ended, the wheels were starting to come off the financial system as we lurched into the global financial crisis and contemporaneous Great Recession. The Fed started to cut rates in the fall of 2007, but there wasn’t much that looser monetary conditions could do to cushion the blow of overleveraged mortgage-backed derivatives exposure on the books of systemically critical financial institutions as real estate prices declined in tandem across the entire country.

Recession Or No Recession?

Is there anything we can learn from these past cycles to give us a sense of what might come next (we are not giving too much thought to the rate cut cycle of 2019 – 2020, because of the uniquely distorting effects of the Covid-19 pandemic that pushed the Fed into its zero interest rate policy)? Well, the sample size is too small to be statistically significant. But just looking at the data might tell us that, from a share price returns perspective, it’s perhaps okay to have a mild recession (like in 1990) but not at all okay to have a recession and a financial markets crisis at the same time (2001, 2008). Even better if we avoid a recession entirely, which, while by no means a certainty, remains our baseline scenario based on the macroeconomic picture we have today.

What drove the Federal Open Market Committee to its decision to opt for the bigger cut this time? Most likely, it was the series of labor market data that came out subsequent to the previous FOMC meeting at the end of July. Most of that data (including a major downward revision by the Bureau of Labor Statistics of earlier jobs reports) pointed to a significant cooling of the labor market. With inflation seemingly under control and trending towards its two percent target, the Fed turned to the other side of its dual mandate and decided to buy a little extra insurance against a further worsening of labor market conditions.

Will that be enough, or will it turn out to be too little, too late? We will have our next batch of jobs data in two weeks, and then a snapshot of general consumer health as we move into the holiday season. Sentiment among retailers seems to be trending optimistic for now (and this week’s retail sales number came in ahead of expectations). That could change, of course, but for now we do not see a compelling reason to pull back in a meaningful way from the growth-focused components of our portfolios.

MV Weekly Market Flash: China In 3D

Demography, deflation and debt. These are the Three Ds of China’s economic lassitude, and they have all been in the news recently. International investors, meanwhile, continue to add a fourth D to the picture – departure. The Shenzhen A shares index, a bellwether of mainland Chinese equities, is down 32 percent from its 2-year high set in February of last year. And it’s not just portfolio managers with their fleet-of-foot capital heading for the exits; US and European businesses with longstanding foreign direct investment in China are rethinking the dependence of their supply chains on a China that has become increasingly difficult to deal with, both economically and politically.

Where Have All The Workers Gone

China’s demographic problems begin and end with its dependency ratio – the number of retirees relative to the working population. That number has been going up as the population ages and the birth rate, even after the end of the disastrous one child per family experiment, declines. Economists project that China will add around 20 million people to its retirement rolls each year from 2023 to 2035, straining its badly underfunded pension system. This week, the government announced its intention to raise the official retirement age for the first time since 1978, gradually extending the age for men from 60 to 63, for women in white-collar jobs from 55 to 58, and for women in blue-collar fields from 55 to 58.

The Japan Syndrome

No amount of tinkering with the retirement age will help China deal with a deep consumer funk that threatens its growth prospects as far ahead as the eye can see. Consumer prices are teetering on the edge of outright deflation – China’s consumer price index currently sits at just 0.6 percent year on year, compared to the 2.5 percent headline CPI number for the US released earlier this week. Households have cut back on spending as the country’s property crisis grows deeper and deeper with little in the way of economic assistance from Beijing. China’s household savings rate is an astonishing 31 percent. When the government does step in, it does so in an oblique way by pumping liquidity into the manufacturing sector, apparently in the hope that industrial production will boost exports and thus circulate money back into the domestic economy. A news article in the Financial Times this week cited a handful of economists arguing that under current conditions, China would need to spend some $1.4 trillion in stimulus outlays to put the country back on a long-term sustainable growth trend.

Bond Bubble

When economic growth prospects look shaky, investors seek safety in fixed income markets, and China is no exception. Massive purchases of government bonds has driven the yield on the 10-year benchmark bond down to an all-time low of 2.1 percent. Banks and nonbank financial institutions have been leading the charge, giving rise to fears of a bond bubble that could decimate banks’ asset quality if rates were to suddenly spike up. As they could well do, given that the total amount of new government borrowing between August and December of this year is estimated to be close to $400 billion. Xi Jinping’s long-term economic strategy calls for substantial investment – meaning lots and lots of debt issuance – in leading-edge green technology to establish global dominance in what Beijing expects to be the growth drivers of the coming decades. The success of that long-term vision is anything but certain; meanwhile, the already-precarious state of the Chinese economy could unravel further still with a widespread debt crisis.

China is the world’s second-largest economy – in fact, it is the largest when ranked by purchasing power parity. The Chinese supercycle, which lasted from the early 1990s through the first decade of the 21st century, is the fastest growth cycle ever recorded in human history. Thus, its current economic troubles reach far beyond the shores of mainland China. The country’s weakness is a key factor, for example, in the economic travails of Germany, whose usually reliable exports of high-value manufactured products languish amid weak demand from China, its biggest market (and these conditions, in turn, explain a good part of Germany’s current political troubles with extreme right wing and left wing political parties winning three recently-held regional contests in the county’s east).

Meanwhile, even with its diminished domestic equity markets, China still makes up around 25 percent of the MSCI Emerging Markets equity index. One way to understand the chronic underperformance of emerging market equities, as we have noted in commentaries over the past several years, is to understand the 3D problem of China – demography, deflation and debt – that does not appear to be going away any time soon.

MV Weekly Market Flash: September, True to Form

You may have noticed that markets have been a tad jittery lately. The S&P 500 is down around 2.6 percent from the beginning of the month, and about 2.9 percent off its last record high set on July 16. There are lots of plausible explanations out there in the crossroads and roundabouts of financial media chatter. Uncertainty about the upcoming election, fears of a potential recession, doubts about whether the Fed is moving fast enough on interest rate cuts – all of these and many more fill up the pages of the Wall Street Journal and the talking heads panels on CNBC.

Wake Me Up When September Ends

Or, it could simply be that we’re in September, the cruelest month when it comes to markets. Last year – which, if you remember, was a pretty good year for US stocks overall – the S&P 500 was down 4.9 percent from the beginning to the end of the year’s ninth month. In 2022, September served up a near-ten percent decline. The story was the same for 2021 and 2020, with September losses of 4.6 percent and 3.9 percent respectively.

In fact, September is historically the worst month of the year going all the way back to 1928, with an average return of minus one percent for the month’s thirty days and a slightly better than 50/50 chance of being down on any given year. Why is this? As with any of the vagaries that challenge the theory of efficient markets, there are debates as to whether the “September effect” is somehow structural or just an anomaly that has no particularly convincing explanation. Maybe investors decide to lock in gains as they come back into the swing of things after the summer. Maybe individuals sell off some of their holdings to pay for school expenses and salt away a bit for the upcoming holidays. If those don’t sound like compelling reasons, well, most economists would agree with you that they’re not. Behavioral economists might say that the putative existence of the September effect creates its own reality – traders sell into the month because they assume everyone else will. Perhaps, or perhaps not.

Jobs, Prices and the Fed

Of course, every September has its own set of circumstances. This year, the market’s attention has turned rather quickly from inflation, which seems to be steadily moving along towards its target level of two percent, to jobs. This week came with another series of reports showing that conditions in the labor market are slowing, but not going into reverse. Today’s report from the Bureau of Labor Statistics had a slight improvement in the unemployment rate – to 4.2 percent from 4.3 percent last month – and about 142,000 payroll gains. The rise in nonfarm payrolls was a bit lower than the consensus forecast of 160,000, but close enough for the market to take it in stride (S&P 500 futures are more or less flat as we are writing this on Friday morning). An earlier report this week on job openings and a payroll survey from ADP also validated the cooling – but not reversing – trend.

That leaves investors uncertain as to whether the Fed will stick to a traditional rate cut of 0.25 percent when the Federal Open Market Committee meets on September 18, or whether it will opt for a larger 0.5 percent cut. Putting on our behavioral economics hats for a moment, we think the larger cut could be counterproductive for stock prices, as it would suggest that the Fed messed up by not cutting rates in July, and is scrambling to catch up to the slowing economic conditions. The job numbers suggest to us that a jumbo rate cut is not necessary. The economy is still creating jobs, inflation is trending down, corporate earnings are on track to grow by more than ten percent for the year, consumer confidence is at a six-month high and households are still spending. It’s time for monetary policy to turn accommodative, but it’s not time for panicky moves. The stock market has managed to survive the past two years without a bailout by the Fed (the renowned “Fed put” of the Greenspan, Bernanke and Yellen years). It can likely continue to thrive in a period of measured easing without the need for extraordinary measures.

MV Weekly Market Flash: The De-Inversion Cometh. What Next?

Thursday morning opened the same way every morning has opened since July 5, 2022 – with the Treasury yield curve inverted at the 2-year and 10-year maturities. That’s 786 consecutive days (counting weekends and holidays) of an inverted curve, the longest on record by far (the previous record was 624 days in 1978). But on Thursday, the difference between the two maturities was a scant three basis points, or 0.03 percent, suggesting that the end of this magnificent streak is fast approaching. Since an inverted yield curve is supposed to be a reliable harbinger of a recession, enquiring minds want to know what happens next. Let’s look at some past data, bearing in mind as always that what happened before is not necessarily going to happen again.

Inversions By The Numbers

We will skip over the very brief recession of 2020, because (a) there was no substantial yield curve inversion to speak of before it happened, and (b) it probably would not have happened at all if the economy had not been manually shut down by the powers that be in response to the Covid-19 pandemic. Let’s look at the three recessions before that, starting with the so-called Great Recession of 2008.

The 2-10 Treasury curve inverted on December 27, 2005, a bit more than two years before the recession started on January 2, 2008. It flitted in and out of inversion for the intervening time, notching up 253 days of being inverted before resuming its normal (upward-sloping) shape on May 29, 2007. So there was about a seven-month gap between the end of the inverted yield curve and the beginning of the recession.

For the recession which began on April 2, 2001, the 2-10 curve tipped into inversion for the first time on June 10, 1998 and also went back and forth between inversion and normal for the more than two and a half years prior to the recession (241 days of inversion recorded). The last inversion occurred on December 27, 2000, about four months before the recession began.

Finally, the 1900 recession began on August 1 of that year. Ahead of that recession, the 2-10 curve inverted for the first time on January 5, 1989 and for the last time on March 19, 1990, a bit less than five months before the recession began.

Define “Near Future”

So what, if anything, does all this past data tell us about what to expect in the coming months? Well, let’s start with what economists normally tell us about inverted yield curves – that they presage a recession in the “near future.” Unfortunately, as the data we presented above show, there is not really a consistent definition to be applied to the term “near future.” Two years came and went between the first curve inversion and the 2008 recession, two and three-quarter years elapsed before the 2001 downturn, and about one and three-quarter years before the 1990 episode. And for each of those recessions, there was a gap of at least several months between the time the curve de-inverted and the downturn began.

All of which says very little for anyone who wants to bet on if and when a recession will occur this time. We are about two years and two months away from that July 5, 2022 start date for this cycle’s inversion. By the time we come back after the Labor Day weekend the 2-10 curve may – or may not – have resumed its normal upward-sloping shape for once and all. If it does, perhaps one could assume a four or five month gap – similar to the 1990 and 2001 downturns – meaning a recession commencing in early 2025. That time frame would seem to fit within the parameters of the previous cases.

The Expectations Game

But is that enough reason to build up a defensive portfolio position ahead of a putative economic downturn in the first quarter of 2025? We don’t think so. For one thing, the shape of the yield curve is in large part an outcome of expectations in the bond market. Expectations about the Fed, expectations about inflation, about the direction of interest rates elsewhere in the world, about the magnitude of the term risk premium, expectations about expectations, and on and on. To be perfectly honest, our confidence in the rationality of bond market expectations has diminished over the past two years – a period in which the market has forever been pricing in expected rate cuts that never happened (which could be a reason why this inversion has lasted for as many consecutive days as it has). In 2021 we witnessed the “meme-ification” of the stock market, and in 2022-23 that unfortunate trend made itself known in the bond market. Remember those six rate cuts that were going to happen in 2024, according to the bond market last December?

Mind you, we are not saying with any certainty that a recession won’t happen next year. We do see the economy slowing, and at some point that slowing could continue into negative growth. But we do not see enough evidence yet to make a compelling case for a strong defensive move out of growth assets and into safety assets. We will continue to assimilate the data, but our actions are very unlikely to be driven by whatever the bond market happens to be telling us on any given day.

Enjoy the long Labor Day weekend, and then buckle up for what may be some interesting times this fall.

MV Weekly Market Flash: If It’s Late August, It Must Be Jackson Hole

Late August means different things to different people. The last chance for a relaxing week at the beach before the new school year begins. Putting up the college flag on the front lawn in anticipation of the upcoming football season. Endless variations on recipes for those fresh tomatoes, straight from the garden. And for finance nerds like ourselves who closely follow the twists and turns of monetary policy, it’s Jackson Hole time. At their annual gathering in the shadow of the majestic Grand Tetons of Wyoming, the world’s leading central bankers pair cowboy hats with their sober business suits and ponder how their policies should meet the present economic moment. The highlight of the week, always, is the Friday speech by the chairperson of the US Federal Reserve, closely watched by market observers for clues about where interest rates and the economy at large might be headed.

The Time Has Come

On many occasions, Jay Powell is circumspect and vague about the Fed’s specific policy direction. Not this year. “The time has come for policy to adjust” said Powell, just a minute or so into his speech this morning. For markets, there was no ambiguity to parse in that pronouncement. Barring something truly extraordinary transpiring between now and September 18, when the Federal Open Market Committee next meets, that meeting will result in an easing of the target Fed funds rate. By how much? Clearly, the Fed chair was not going to go that far. Our baseline assumption is that the FOMC will cut rates by 0.25 percent at the September meeting, with a reasonable likelihood of two more cuts of the same magnitude in this year’s remaining meetings on November 6 and December 18.

That assumption, of course, is subject to new data received between now and then. Powell expressed a high degree of confidence that inflation is on a sustainable trajectory to reach the Fed’s two percent target – a level of confidence missing from recent post-FOMC press conferences. The trickier issue now is the other side of the central bank’s dual mandate: employment. Unemployment has ticked up in recent months and now stands at 4.3 percent, almost a full percentage point higher than where it was a year ago. Powell did note today that, at least for the moment, higher unemployment is more a function of new entrants to the labor market than of widespread layoffs (a point we have also made in recent commentaries, most notably a few weeks ago when the market freaked out over the softer than expected July jobs report). Still, the Fed does not want to see labor market conditions turning notably worse, and that would appear to be the driving factor behind Powell’s clear assertion that the time to act is now.

The Sinking of the Good Ship Transitory

Powell injected a note of humor into his speech, one that also reflected an attitude of humility that was pleasing to see. Three years ago, the Fed was prominent among institutional voices arguing that the inflation that had started to build up in 2021 was of a “transitory” nature, brought about by temporary supply chain dysfunction during the pandemic and the (so it was thought) equally temporary spike in demand as housebound Americans used their government stimulus checks to purchase new Peloton machines and backyard grills and whatnot. By the end of that year, however, it was clear that this bout of inflation was going to be anything but transitory. The experts were wrong. As Powell humorously put it in his speech, “the good ship Transitory was a crowded one, with most mainstream economists and advanced-economy central bankers on board.” The Fed had to pivot, and in March 2022 they commenced the monetary tightening policy that brought the Fed funds rate to the 5.25 – 5.0 percent target range where it sits today.

Beyond the nautical humor, there was an important message in Powell’s speech for all of us with skin in the game. The experience of the pandemic economy was like nothing else that had gone before it. Never in all the decades of recorded macroeconomic data had there been a contraction in GDP that deep, followed by a rebound as robust as the one that occurred in the space of just two quarters in 2020. None of the economic models employed by mainstream economists could countenance the rapid drop in inflation that occurred after its June 2022 peak happening alongside an environment of historically low unemployment. In many ways the Fed and other central banks were flying blind as they tried to navigate consumer prices and the labor market back into some kind of balance. Fortunately, they kept their focus on reaching their targets and managed to ignore much of the second-guessing and periodic freak-outs bubbling up in the markets during this period.

Powell finished his speech on this note: “The limits of our knowledge – so clearly evident during the pandemic – demand humility and a questioning spirit focused on learning lessons from the past and applying them flexibly to our current challenges.” Well put. All of us in this business could stand to bring a similar attitude of open-mindedness, humility and willingness to adapt as we carry out our work on a daily basis.

MV Weekly Market Flash: Apocalypse Not

Two weeks ago to the day, a soft jobs report sent risk asset markets into a tizzy. The report from the Bureau of Labor Statistics on August 2 seemed in investors’ minds to validate two data points from earlier that week, one a survey on manufacturing activity and the other a weekly tally of new filings for unemployment, suggesting that the economy was slowing at a faster than expected clip and could be in recession by the end of the year. Bearish sentiment ticked up. Investors bought lots of Japanese yen because that’s one of the things people do when a risk-off mood sets in (and also because the Bank of Japan raised interest rates). That, in turn, sent Japanese stocks into a double-digit tailspin the following Monday, and for the briefest of moments it looked like the apocalypse was at hand. The CBOE VIX index, a measure of volatility, shot up and closed at a higher level than at any time during the 2022 bear market (at one point during the day it reached levels not seen since the global financial crisis of 2008).

As the chart shows, the fear peaked very quickly and then plummeted. A handful of upbeat macro reports last week contrasted with the gloomier tone of the prior week’s data. Fed officials pushed back hard against the panicky calls for an emergency rate cut that pinballed from one talking head to another in the financial media. By the time last week’s new unemployment claims filings came out lower than expected (i.e., fewer new claims filers), the composite picture seemed to be more or less back to what most of us have been projecting as a base case for some time now – slowdown yes, recession no.

Crossing 3.0

Another important piece of the economic puzzle was up for review this week. On Wednesday we learned that the headline Consumer Price Index fell below three percent (year-on-year) in July, registering at 2.92 percent with a slowing in most categories (shelter being a notable exception). The CPI excluding food and energy prices also continued its downward trajectory, with prices rising 0.2 percent in July for a year-on-year increase of 3.2 percent. These numbers were more or less in line with expectations and probably strengthen the case for the Fed to finally begin cutting rates when the Federal Open Market Committee meets on September 18. How much? In the wake of the market jitters from early last week, the bond market was pricing in a full 0.5 percent September rate cut. We think that is unlikely. Following Wednesday’s CPI report, we got more evidence of consumer strength with a better than expected retail sales report on Thursday (and yet another week of lower than expected new unemployment filings). A standard-issue 0.25 percent reduction in the Fed funds target seems to be appropriate for an economy that is still growing (at a slower rate) while inflation moves incrementally lower.

Next Week In Jackson Hole

So it would seem that the apocalypse is not at hand. That doesn’t necessarily mean that all’s well and back to the brandy. Our key takeaway from the past couple weeks is that markets are twitchy, and it doesn’t take much for sentiment to suddenly lurch negative. Valuations remain expensive by historical standards. Geopolitical developments are very much in the news, and while they normally don’t have an outsize effect on market trends, they can contribute to an overall vibe of uncertainty.

Next week is the last week of August, and for central bankers that means a week in the idyllic environs of Jackson Hole, Wyoming. The Jackson Hole confab often serves as a platform for the Fed to set out a policy vision, and we may get a clear message from Jay Powell, when he gives his keynote address next Friday, about what to expect from the Fed between now and the end of the year. He is likely to reaffirm the points he made two weeks ago about the twin goals of stable prices and healthy employment coming into better balance. Whether he goes further to guide conclusively towards that September rate cut remains to be seen – but it might help markets become a little less twitchy.

MV Weekly Market Flash: Notes From A Weird Week

It’s been a minute, as they say. What to make of it all? Let’s start with that first bit of news to which we all woke up on Monday morning, namely a 12 percent drop in the Nikkei 225 benchmark index of Japanese stocks. That one-day plunge had those of us who were around and following markets in October 1987 reminiscing, and not necessarily in a good way. It’s worth noting that Monday’s percentage loss was twice the magnitude of the six percent drop in the Nikkei immediately following the earthquake in 2011 that produced a meltdown in the Fukushima nuclear plant. And for what – a small hike in interest rates by the Bank of Japan and a smaller than expected increase in US job gains?

About Those Jobs

So let’s talk about those jobs numbers last week. What seemed to cause the most uproar and consternation among the endless panels of red-faced, hyperventilating guests on financial media sites last Friday was the uptick in the unemployment rate to 4.3 percent. Pundits were falling over themselves to explain how the Sahm Rule (something they had probably Googled minutes before while biding time in the CNBC green room) put that 4.3 percent unemployment rate squarely in the crosshairs of an incipient recession.

But not all unemployment rate increases are driven by the same thing; specifically, some come about from the demand side (currently employed people losing their jobs) while others are supply side events (an increase in the number of labor force participants). As economist Jim Paulsen helpfully explained in a piece this week, the number of unemployed Americans has risen by about 1.04 million so far this year, but at the same time the labor force has grown by about 1.2 million. So it seems like more of a supply thing, i.e. the number of people looking for work outpacing the number of workers getting the pink slip. That is much less of a recipe for recessionary storm clouds on the visible horizon.

Oh, and part of the jump in initial unemployment claims, which was another closely-watched data point last week, was due to the recent effects of Hurricane Beryl in some significant job markets that lay in her path. This week’s new claims numbers came in better than expected, adding validation to the argument against this being a structural trend.

Has The Carry Trade Played Itself Out?

Back to Japan, and that crazy Monday in Tokyo. Those of you who read our special comment earlier this week will have received an explanation of the so-called “carry trade” in which investors borrow cheaply in yen to invest in higher-returning opportunities elsewhere. The Bank of Japan’s move last week sent the yen soaring more than 12 percent against the dollar, effectively wiping out the attractiveness of this very popular strategy among international institutional investors. Selling begat more selling, and there were serious concerns as to how much potentially was at stake as those caught like deer in the headlights over the BoJ’s rate hike unwound their positions.

We still do not have a definitive answer to that question, but we take it as a good sign that the rest of this week has dialed back the chaos seen on Monday. Market’s are still choppy and volatile, but we do not see obvious signs of the kinds of distress selling that would potentially result in more days of massive percentage losses among global asset classes. We will credit the Fed for playing a constructive role here in helping to calm nerves. After Monday’s carnage there were the usual frantic calls among market participants for “emergency” measures by the Fed, meaning a non-scheduled rate cut just days after the central bank held firm on its policy rate last week. Fed members correctly noted that it would take a great deal more than one report showing 114,000 payroll gains for the Federal Open Market Committee to conclude that a real emergency was clear and present. The so-called “Fed put” of prior periods, which is market shorthand for a Fed bailout in periods of temporary distress for asset prices, has been entirely absent from the Powell Fed’s monetary policy regime of the past two years, and we expect that it will remain dormant.

What’s Next?

Looking ahead, we expect the next significant piece of news the market will latch onto will come next Wednesday with the July Consumer Price Index (CPI) report. Economists expect to see a monthly increase of 0.2 percent in consumer prices (excluding the volatile categories of food and energy), which would translate to a year-on-year increase of 3.2 percent and a continuation in the right direction towards the 2.0 percent target rate. If the actual number comes in at or below that consensus forecast, it should be received as another positive indicator. Be prepared for some mayhem if it goes the other way, though. Also on tap at the end of next week will be the Michigan consumer sentiment report to give us an update on how US consumers are feeling about life in general these days. A week later comes the annual confab of global central bankers at Jackson Hole, Wyoming, which often serves as a platform for the Fed chair to give markets a specific taste of what he and his colleagues have in mind for near-term policy.

August, as we have often noted, can be a volatile month with customarily lighter than average trading volumes and thus the potential to exacerbate the reaction (positive or negative) to new developments. As always, we caution about letting emotions interfere with the patience and discipline required for adhering to long-term financial objectives. Part of this discipline involves being very careful about some of the promises offered by certain investment products that purport to over safe havens in times of distress. We will be talking about some of these in our commentaries in the weeks ahead.

MVF Special Update: 08/06/2024

To Our Valued Clients:

As you are no doubt aware, there has been a considerable amount of volatility in global investment markets over the past several days. While we endeavor to keep you informed about important market developments on a weekly basis every Friday, we thought that the unusual amount of choppiness, along with some at times (in our opinion) overblown chatter in financial media outlets, merited a special comment a few days ahead of our regular Friday commentary. The key point we want to emphasize here it that yesterday’s big pullback, with the S&P 500 declining by 3.0 percent from its close last Friday (and just about 8 percent from its recent July 10 high), had less to do with the state of our economy than some of the stories you may have seen in the news suggest. Yes – last week we did see several pieces of data, culminating with Friday’s monthly jobs report, pointing to a slowdown in the economy. That is not necessarily surprising; indeed, the entire goal of the Fed’s monetary tightening policy over the past two years has been to cool off the economy enough to bring inflation down to the target rate of 2.0 percent. That goal is nearing its end, and at the most recent Fed monetary policy meeting last week, Fed chairman Jay Powell indicated that the central bank’s dual goals of low inflation and a healthy labor market are close to being in balance. The Fed believes – and we concur with their assessment – that reaching its target inflation goal can be achieved without triggering a US economic recession. That view continues to be our base case assumption, though of course we continue to follow the data closely and challenge our thinking on a regular basis.

So what happened in these past couple days of trading? Well, at the same time that the Fed held interest rates steady last week and hinted at a September rate cut, the Bank of Japan raised interest rates. That move prompted a radical jump in the value of the Japanese yen, which rose more than 12 percent against the dollar. Here’s why this matters. For a long time, with interest rates in Japan being either zero or in negative territory, international investors have favored a strategy called the “carry trade” in which they borrow money cheaply in yen-denominated securities and then invest in higher returning opportunities elsewhere in the world. When the yen rose by so much in such a short time frame, those carry trades became instantly unprofitable and triggered a major wave of selling. Much of the selling took place among some of the most profitable investments to date in 2024, including the hitherto artificial intelligence sector. As often happens, selling begat more selling. Stocks in Tokyo were down 12 percent on Monday, which was the main catalyst for the sell-off as markets opened in Europe and then the US.

As we write this on late morning Tuesday, market conditions have at least temporarily stabilized. That does not mean that there won’t be more volatility in the days ahead, particularly as August tends to be a lighter trading month where thinner volumes can exacerbate market moves. But we see a higher likelihood of this being one of those periodic pullbacks that happens with relative regularity, rather than a more structural and protracted decline like the conditions prevailing in 2022, when the Fed began its tightening policy. We will note that last year, which was overall a very strong year for US stocks, saw two occasions (in March and October) when the S&P 500 fell by more than 5 percent in a concentrated period of selling. On that second occasion, in October last year, the benchmark index fell by more than 10 percent, which is the technical threshold for a “correction” in Wall Street speak.

We will continue to keep you informed as to our thinking in this important period leading to the end of the year. As always, we are available to speak with you in further detail should you have ongoing concerns or questions.

MV Financial

Meet Our Team

Smart Strategies.

Investment Advisor Company