Meet Our Team
MV Weekly Market Flash: Europe’s Ongoing Malaise
MV Weekly Market Flash: The Non-Predictive Jobs Numbers
MV Weekly Market Flash: Mixed Bag and a High Bar for Earnings
MV Weekly Market Flash: So Much for Bond FOMO
MV Weekly Market Flash: Geopolitics and the Indifference of Markets
MV Weekly Market Flash: Hot Jobs, Hot Bonds
MV Weekly Market Flash: A Brief History of Markets and Shutdowns
MV Weekly Market Flash: Wild Times For Safe(?) Assets
MV Weekly Market Flash: Oil, Inflation and Consumers
MV Weekly Market Flash: Petulant China

MV Weekly Market Flash: Europe’s Ongoing Malaise

Read More From MV

Europe is stuck in an economic rut. Don’t take our word for it. Take it from Mr. Whatever It Takes himself, former ECB chief and ex-Italian prime minister Mario Draghi, who said this week and we quote (as reported in the Financial Times from an FT Global Boardroom Conference): “It is almost sure that we are going to have a recession by year-end.” The numbers bear out Draghi’s downbeat take on things in his part of the world. Real GDP growth was minus one percent for the third quarter, while the Purchasing Manager’s Composite Index, a measure of economic health,...

Read More

MV Weekly Market Flash: The Non-Predictive Jobs Numbers

Read More From MV

Jobs Friday is here again. The first Friday of every month brings us the widely-anticipated report by the Bureau of Labor Statistics on the health of the US labor market. It’s a useful set of data for showing us what sectors of the economy are adding more jobs, how many people with part-time work are actively looking for full-time jobs, the extent to which hourly wages are keeping up with inflation (pretty well these days, actually) and so on. What the jobs report does not do, no matter how many talking heads on the financial news shows may tell you...

Read More

MV Weekly Market Flash: Mixed Bag and a High Bar for Earnings

Read More From MV

The third quarter earnings season is in full swing, with a bevy of tech companies in the spotlight this week along with the tail end of the financial institutions that got things rolling two weeks ago. The results so far? The stock market’s unimpressive performance since the Q3 season got underway suggests a less than rosy view among analysts and investors. The S&P 500 is down almost ten percent from its year-to-date high on July 31, flirting with that psychologically meaningful threshold for a technical correction (though we may get a reprieve today if the market manages to hold onto...

Read More

MV Weekly Market Flash: So Much for Bond FOMO

Read More From MV

Sometimes it seems like we do nothing around here but write about bonds. Unfortunately, what is normally the dullest category in the pantheon of portfolio assets is where all the action has been this year. Where the action is, attention must be paid. Here’s a twenty-year picture of the 10-year Treasury yield, which this week has been bellying up to the five percent level last seen in the summer of 2007. Year of the Bond Let’s cast our minds back to about one year ago, when the 10-year yield was hurtling towards four percent (a level that at that time...

Read More

MV Weekly Market Flash: Geopolitics and the Indifference of Markets

Read More From MV

The financial world is full of timeless bits of advice veterans of the system give to those just coming on board. One such hoary old saw is to pay no attention to geopolitics. While wars, terrorist attacks and the like dominate the lead stories on the nightly news, they rarely make much of an impact on financial markets, and any such impact is usually short-lived. That’s the advice, and there is some pretty solid historical data to support it. Consider this past week. Last Saturday, Israelis woke to the deadliest terrorist attack in their country’s history, with a known death...

Read More

MV Weekly Market Flash: Hot Jobs, Hot Bonds

Read More From MV

Does anyone really know what is going on with the US economy? Anyone? Bueller? Recession chatter has been rising again in financial circles, as economists take note of tapped out savings and rising consumer debt levels. Then along comes the latest jobs report from the Bureau of Labor Statistics, showing that nonfarm payrolls rose by 336,000 in September, more than twice as many new jobs as those very same economists had predicted. astrologerliaquatsibtian.com That represents the largest monthly increase in payrolls since January. The unemployment rate is 3.8 percent, and while the third quarter GDP report is still three weeks...

Read More

MV Weekly Market Flash: A Brief History of Markets and Shutdowns

Read More From MV

The US stock market has been in one of those glass-half-empty moods for some weeks now, down nearly seven percent from the year-to-date high reached on July 31. There are several objects in the grab bag of negative news offered by the financial press to explain Mr. Market’s current malaise, one of them being the seemingly inevitable government shutdown about to happen. Given that the shutdown technically goes into effect on Sunday night (unless Congress has a magic trick to reveal that nobody has seen yet), this would seem to be a good time to take a closer look at...

Read More

MV Weekly Market Flash: Wild Times For Safe(?) Assets

Read More From MV

Bonds for safety and equity for growth – this is the basic formula for long-term investment planning, the essence of portfolio construction around a client’s specific return objectives and risk tolerance. With that formula in mind, take a look at the chart below. Without looking at the labels, which one of the two price performance lines would you think represents a common stock index, and which depicts the yield for 10-year Treasury securities? You would intuitively think that the line that moves with less up-and-down variance would be the one representing the safer asset – the one used as a...

Read More

MV Weekly Market Flash: Oil, Inflation and Consumers

Read More From MV

The Federal Open Market Committee will meet next week to determine whether to raise interest rates again. The broad consensus among those who pay attention to the FOMC’s doings is that they will not raise rates. The inflation measure the Fed pays attention to is more than two percent lower today than it was in September last year (4.39 percent compared to 6.64 percent, expressed on a year-on-year basis). That’s still more than two percent higher than where the Fed wants inflation to be, but it has been moving steadily in the right direction. Holding rates higher for longer will...

Read More

MV Weekly Market Flash: Petulant China

Read More From MV

This should be the best of times for Apple, the world’s most valuable company with a $2.8 trillion market capitalization. The company is ever so close to knocking rival Samsung off its perch as the leading seller by volume of smartphones. Next week will see the launch of the iPhone 15, the company’s newest model, along with all the overcaffeinated hype that accompanies any Apple new product launch. And even in an environment where overall smartphone sales by unit are set to decline for a second consecutive year, Apple continues to set revenue records in its Services segment, which includes...

Read More
MV Weekly Market Flash: Europe’s Ongoing Malaise

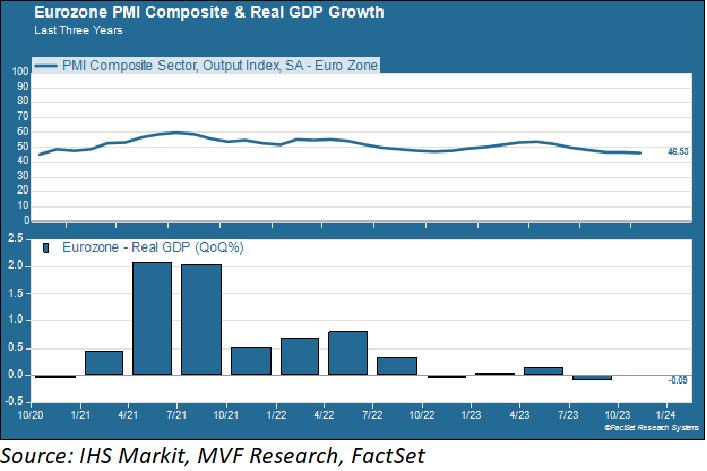
Europe is stuck in an economic rut. Don’t take our word for it. Take it from Mr. Whatever It Takes himself, former ECB chief and ex-Italian prime minister Mario Draghi, who said this week and we quote (as reported in the Financial Times from an FT Global Boardroom Conference): “It is almost sure that we are going to have a recession by year-end.” The numbers bear out Draghi’s downbeat take on things in his part of the world. Real GDP growth was minus one percent for the third quarter, while the Purchasing Manager’s Composite Index, a measure of economic health, has been in contractionary territory since the middle of this summer (a PMI reading below 50 indicates contraction, while 50 or more means expansion).

Left Behind

Draghi’s concerns about the Eurozone’s economic prospects center on the fear that the region is falling further behind both the US and China in terms of global competitiveness. The European model for much of the past decade or so could be summed up as a tripartite dependence syndrome: on the US for defense, China for trade and Russia for energy. In fairness, Europe has done a great deal to change the third part of that dependence, demonstrating since the outset of Russia’s invasion of Ukraine in February 2022 that it was capable of weaning itself off Russian energy flows, particularly natural gas. On the trade front, though, China’s ongoing struggles with its own economy arguably are the key reason for that recent string of underwhelming EU GDP numbers. Europe is a major manufacturer of high-value goods, and China is an all-important customer. Germany, in particular, has felt the pain of diminishing demand for its China-bound exports.

The sense of falling behind is perhaps most acutely felt in comparison to the improved fortunes of the US economy. The gap between economic output between the US and the EU is growing; in 2013, EU GDP was roughly 91 percent of the US. Ten years later, that ratio is 65 percent, and even more pronounced on a per capita basis. A look at the composition of US and European stock market indexes offers a clue as to why. About 40 percent of the MSCI EU stock index is made up of companies in the industrial, financial services and energy sectors. Information technology, where much of the growth in the last decade or more has taken place, accounts for just ten percent of the index. That is a marked difference from US indexes like the S&P 500, where tech dominates not just in the formally designated information technology sector itself, but elsewhere like consumer discretionary (Amazon, Tesla) and communication services (Alphabet (Google), Meta (Facebook), Netflix).

Chronic Underperformer

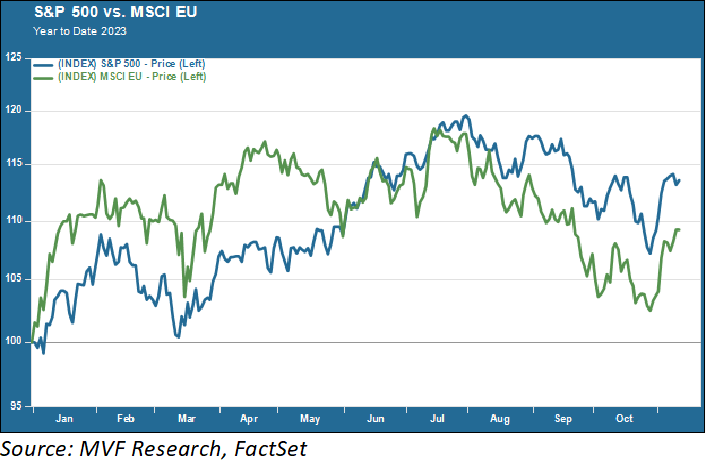
And how have those EU stock indexes been faring this year? Let’s take a quick trip back to January, when “buy Europe” was one of the big themes among the financial chattering classes (that is, when they weren’t imploring you to buy 10-year Treasuries because you were never going to see yields as high as 3.5 percent ever again…oops).

Indeed, that looked like a pretty good trade for a while, as the above chart shows. But when we take into account the picture for the full year to date, we get a good lesson in why tactical investing is usually a bad idea. What sell discipline would have convinced you to start unloading your MSCI EU shares in May, when they started going the other way and eventually did what they have done so often in the past thirty years, i.e. fall behind the US?

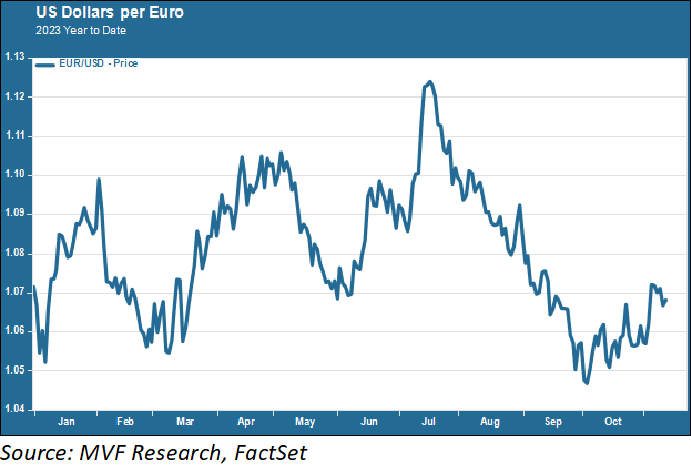
And it’s not like there was some compelling structural case to make as to why Europe might suddenly look attractive, back in January. In fact – and this tends to be true more often than not – the main catalyst for the three distinct upward moves in the EU index – in January, March and July – all coincided with a concurrent rise in the value of the euro relative to the dollar.

For a US investor with a dollar-denominated portfolio, gains or losses from overseas investments derive from the organic performance of the asset in question along with the translation value of that asset’s home currency back into dollars. As for the euro, it has gone up and down this year against the dollar but is currently sitting not too far off from where it started the year. Much ado about nothing.

As most of you know, our investment philosophy is centered on the belief that long-term discipline, based on a strategic assessment of the relative risk-return qualities of different assets, is the key to success. Trying to time effervescent short-term opportunities through tactics is more often than not bound to turn out poorly. This explains the persistence of underweight allocations to non-US international equities in our portfolios for many years now. For Europe in particular, we defer again to Draghi and his take on things at the FT conference: “The geopolitical model upon which Europe rested since the end of the second world war, is gone.” Indeed, and while we will pay close attention to how the region addresses the challenges to its global competitiveness, we do not foresee a sea change in the immediate future.

MV Weekly Market Flash: The Non-Predictive Jobs Numbers

Jobs Friday is here again. The first Friday of every month brings us the widely-anticipated report by the Bureau of Labor Statistics on the health of the US labor market. It’s a useful set of data for showing us what sectors of the economy are adding more jobs, how many people with part-time work are actively looking for full-time jobs, the extent to which hourly wages are keeping up with inflation (pretty well these days, actually) and so on.

What the jobs report does not do, no matter how many talking heads on the financial news shows may tell you otherwise, is say anything about where the economy is headed. The predictive power of the BLS and other labor market reports, for all their usefulness otherwise, is roughly zero.

Looking Backward

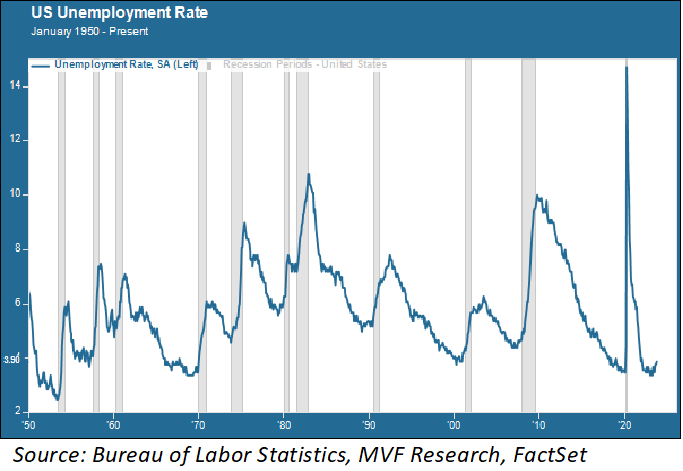
The chart below shows the US unemployment rate going all the way back to 1950. The gray columns represent recessionary periods.

Each of these recessions had its own unique set of features – to paraphrase Tolstoy, every unhappy economy is unhappy in its own special way. But one thing is common to each of them: the unemployment rate didn’t start to shoot up until after the recession had begun – and then it soared. Which makes complete sense – companies don’t start laying off people in droves until business is already bad. If it’s bad across the whole economy, those layoffs will come quickly and in large numbers. The unemployment rate can double in just a couple months or so, as the chart shows. In the parlance of economists, unemployment is a lagging indicator. It tells us where we’ve been, not where we’re going.

Cooling Off

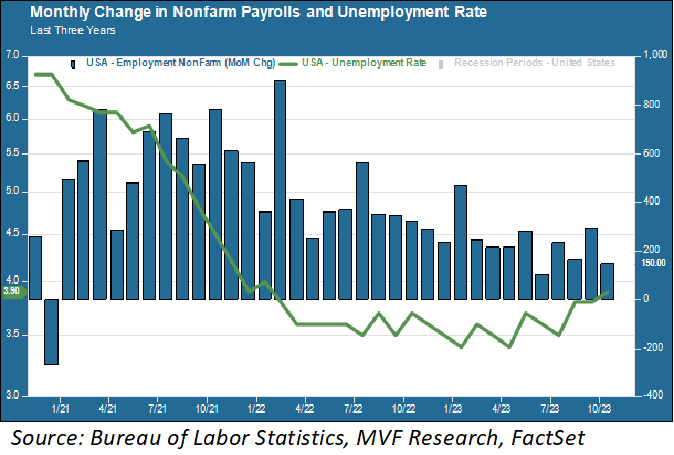
Looking backwards has its own uses, though. Here below we show the unemployment rate combined with the change in nonfarm payrolls for the past three years.

What this chart tells us is that the labor market is cooling off, relative to where it was a year or two years ago. Again – this says nothing about whether we are heading into a recession or whether the economy will turn up again. It says that payrolls are growing at a slower rate than they were (with obvious exceptions like last month’s barnstormer of nearly 300,000 adds), and the unemployment rate is ever so slowly rising off its recent lows (though the current rate of 3.9 percent is still quite low by historical standards, as the earlier chart illustrates.

This picture actually looks pretty good for the Fed, which is probably why stocks started rising and bond yields fell when the BLS report came out this morning. For the Fed, a cooler jobs market suggests a higher likelihood of inflation continuing to moderate, meaning it can stop raising interest rates (which is how the market is reading it today). Once again – nothing here is telling the Fed or anyone else what the economy will look like one month or six months from now. No predictive intelligence here. But if a moderately cooling economy is where we are today, that’s good enough for now.

MV Weekly Market Flash: Mixed Bag and a High Bar for Earnings

The third quarter earnings season is in full swing, with a bevy of tech companies in the spotlight this week along with the tail end of the financial institutions that got things rolling two weeks ago. The results so far? The stock market’s unimpressive performance since the Q3 season got underway suggests a less than rosy view among analysts and investors. The S&P 500 is down almost ten percent from its year-to-date high on July 31, flirting with that psychologically meaningful threshold for a technical correction (though we may get a reprieve today if the market manages to hold onto its opening gains). From what we have seen so far, though, it’s not that the numbers coming in are uniformly bad – it’s that there are some hits and some misses, but there is also a high expectations bar.

Inflation, Sales and Profits

One of the big themes keeping that expectations bar high is, ironically, the fact that inflation is coming down. Take the case of Procter & Gamble, the consumer goods behemoth. P&G’s standard-issue formula for making money boils down to how much it can sell and at what price. Lately the first part of that formula has been lackluster, with unit volumes flattish in most segments. The price component, though, has been robust as the company’s relentless focus on brand differentiation has enabled it to pass on higher prices to its customers. In its latest management call, though, company executives noted that the runway for major price increases is growing short, with a near-term reversion likely to a more balanced relationship between volume, price and product mix. Partly this is due to the fact that overall inflation continues to trend down, and partly due to expectations widely held among management teams in similar situations to P&G that consumers are becoming more frugal and are likely to spend less than they have been in the past couple years.

This trend seems to be causing the analysts who cover these companies to lower their forward expectations. The outlook still looks good for the third quarter, with the expected overall growth rate in S&P 500 earnings per share now standing at 2.45 percent, up from what the same analysts had been predicting a few months ago. But their outlook for the fourth quarter has come down from high single digit growth to low single digit growth, according to FactSet, a market data research firm.

Upside Surprises Keep a-Coming

Might those analysts be underestimating things? After all, 2023 has been a year of one upside surprise after another in the US economy. Most recently, the initial third quarter GDP report that came out yesterday showed real GDP growth of 4.9 percent, far exceeding economists’ consensus estimate and well above what is considered to be the national economy’s baseline growth capacity. The GDP surprise is in line with the continued resilience in the jobs market, consumer spending trends and even somewhat better than expected recent numbers in housing sales. The dramatic rise in interest rates over the past year and a half was supposed to cool the economy by much more than it has so far. That much hoped for soft landing the Fed has been trying to engineer may actually come to pass. If so, the current wobbles in equity markets may prove to be temporary and revert to a more seasonally typical upswing as the holiday season gets under way. We will get a better sense of this later in the earnings season when the bulk of consumer-facing retail companies come out with their reports. For now, though, the expectations bar remains high.

MV Weekly Market Flash: So Much for Bond FOMO

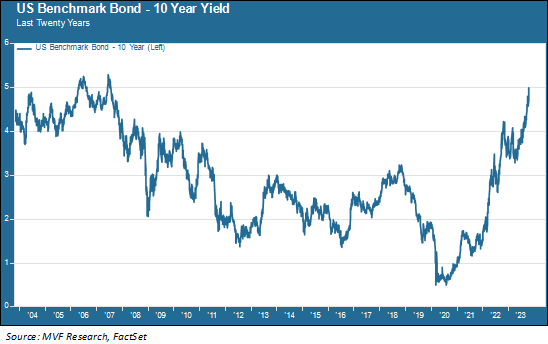
Sometimes it seems like we do nothing around here but write about bonds. Unfortunately, what is normally the dullest category in the pantheon of portfolio assets is where all the action has been this year. Where the action is, attention must be paid. Here’s a twenty-year picture of the 10-year Treasury yield, which this week has been bellying up to the five percent level last seen in the summer of 2007.

Year of the Bond

Let’s cast our minds back to about one year ago, when the 10-year yield was hurtling towards four percent (a level that at that time had also not been seen in over a decade). This was a “once in a lifetime opportunity” said just about anyone with a bond strategy to sell. Investors got the message. Suddenly, the FOMO (fear of missing out) that had recently been the dominant vibe in areas like cryptocurrencies and loss-making tech companies with improbable growth scenarios was now making itself felt in the staid, buttoned-down world of fixed income. As buyers rushed in, prices went up and yields fell, giving an even more urgent sense of scarcity value to the yields on offer. Financial media outlets rang in the New Year in January 2023 as the “year of the bond.”

Lessons From History

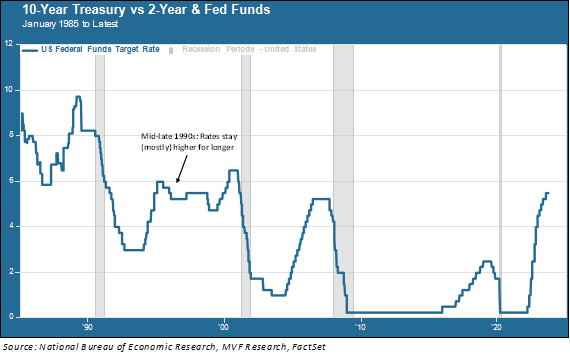
The rush to lock in yields when the 10-year was around 3.5 percent, which is where it was at the start of this year, was not irrational. The Fed funds rate was at 4.5 percent, and many economists were of the opinion that the tightening cycle would come to an end before short-term rates got to five percent. Investors with an eye for history looked back at several decades of Fed monetary policy and concluded that, usually, rates start coming down pretty quickly after the Fed funds hits its peak. Moreover, the rate cuts normally happen because a recession is looming on the horizon – and the widespread assumption at the beginning of this year (including by us) was that a recession was likely in store for 2023 as well. The chart below illustrates this pattern – notice how the rates start coming down right at the doorstep of the recessions in 1990, 2001 and 2008 (2020 is a different case, since the rate cuts happened for different reasons and before anyone knew there would be a recession caused entirely by a global pandemic).

So far so good. But there were two things missing in the rationale of rate cuts and historical precedence. First, the time period shown in this chart does not include any period in which inflation was an actual, clear and present, top-line economic problem. The Fed’s credibility as a central bank rests primarily on its willingness to do whatever it takes to keep inflation under control. In the 1970s it lost a lot of its credibility for that very reason – constantly bouncing back and forth between fighting inflation and fighting recessions, ultimately leading to stagflation. Jay Powell, the current Fed chair, is astutely aware of the history of the organization he leads. His insistence from the beginning of the current tightening program that rates would stay high until inflation was under control again should have been taken more seriously by the bond market. It wasn’t, and a year later, with the Fed funds at 5.5 percent and the 10-year at the five percent Rubicon, investors are feeling the pain.

The second missing part of the rate cut rationale was asking what happens if the recession doesn’t materialize. For this, consider what happened in the second half of the 1990s. The Fed had raised rates starting in February 1994, a move which took the market by surprise and was seen as a pre-emptive move by the bank to head off a potential return of inflation. Rates eased a bit after the July 1995 peak, but stayed at an elevated level for the remainder of the decade. Recall that the economy was growing during this period, there was no recession, and the Fed decided it was prudent to keep rates higher for longer to ensure that the strong economy didn’t run so hot as to bring back inflation.

All of which is to say that markets are subject to millions of things happening all the time that can upend what may seem like the most compelling of cases. Yes, bonds looked attractive twelve months ago when the 10-year was at four percent. We had many spirited discussions in our investment committee meetings at the time, not to mention a barrage of enticements by various money managers trying to sell us on FOMO. We also believed that a recession was more likely than not. But we also listened closely to Powell and his colleagues at the Fed, and took seriously their insistent repeating of the higher for longer mantra, and thus took slow and cautious steps rather than rushing pell-mell into longer durations. The good news, such as it is, is that bonds generally may be able to supply something they have not for a long time, namely a stable source of income for clients at a stage of life where income is important. Neither we nor anybody else knows what is going to happen with yields in the coming days or weeks or months. But we do not see the income opportunity going away any time soon.

MV Weekly Market Flash: Geopolitics and the Indifference of Markets

The financial world is full of timeless bits of advice veterans of the system give to those just coming on board. One such hoary old saw is to pay no attention to geopolitics. While wars, terrorist attacks and the like dominate the lead stories on the nightly news, they rarely make much of an impact on financial markets, and any such impact is usually short-lived.

That’s the advice, and there is some pretty solid historical data to support it. Consider this past week. Last Saturday, Israelis woke to the deadliest terrorist attack in their country’s history, with a known death toll now exceeding 1,300. The brutal terrorist attack by Hamas, and Israel’s subsequent declaration of war on the group that has controlled the Gaza Strip since 2007, will likely reverberate throughout the Middle East for a long time to come in ways that we can’t fully comprehend today. It will be yet another major foreign policy headache for a world already dealing with the war in Ukraine, the ever-present threat of crisis in Taiwan, and unsteady domestic politics in much of the developed Western world.

Business As Usual

Yet financial markets have barely registered any reaction at all to the events of October 7. US stock and bond markets have remained focused on their usual themes this week, with interest rates and Fedspeak at their customary top of the list. Bond yields fell significantly after some seemingly dovish comments by a few Fed officials suggested that the recent rise of intermediate and long-duration yields might be doing the Fed’s work for them and thus reduce the urgency for another rate hike when the FOMC meets at the beginning of next month. A mostly in-line but slightly hotter than expected inflation report on Thursday took some of the enthusiasm out of that dovish narrative. The stock market this morning is mixed, with optimism concentrated in the banking sector where the first batch of third-quarter earnings reports from heavyweights like JPMorgan Chase, Citi and Wells Fargo has received a warm welcome. Even oil markets, which could be expected to be much more reactive to events in the Middle East, have not gone crazy.

The Fog of War

Why are markets so blasé about geopolitics? There are two main reasons, one of which is perfectly rational and the other of which is potentially past its expiration date. First, the rational explanation. It is very hard to translate a geopolitical crisis into a set of known or highly probabilistic outcomes to which a tangible value can be attached. If we consider those three major flashpoints in today’s world – Ukraine/Russia, China/Taiwan and Israel/Hamas – there is much more fog than clarity about (a) how the conflicts might be resolved and (b) what the downstream knock-on effects of any such resolution might be. This is a vastly different problem from, say, mapping out valuation scenarios for growth equities in the technology sector following a one-percent change in interest rates. “When in doubt, leave it out” is another one of those old chestnuts shared around securities firm trading floors.

The second reason for the market’s usual indifference to world events stems from a longstanding, and by now in our opinion outdated, assumption that the background scenery of the global political order doesn’t change at anything more than a glacial pace. This assumption is rooted in the so-called “Washington Consensus” that gained popularity back in the 1990s – the belief that free movement of capital, light-touch regulation, free trade and globalization-friendly political systems under the benevolent leadership of the United States was and would continue to be the way of the world. That assumption is no longer relevant, but it is entirely unclear what is going to replace it.

Wall Streeters often talk of a “wall of worry” when listing things that, while individually perhaps not packing much of a punch, pose a threat to asset price trends when added together. We would add geopolitical uncertainty to whatever else is piling up on investors’ wall of worry, and are not inclined to dismiss it as irrelevant. We remain comfortable with where our portfolio positioning is today, but at the same time we are prepared to expect more, rather than fewer, surprises in the year ahead.

MV Weekly Market Flash: Hot Jobs, Hot Bonds

Does anyone really know what is going on with the US economy? Anyone? Bueller? Recession chatter has been rising again in financial circles, as economists take note of tapped out savings and rising consumer debt levels. Then along comes the latest jobs report from the Bureau of Labor Statistics, showing that nonfarm payrolls rose by 336,000 in September, more than twice as many new jobs as those very same economists had predicted. astrologerliaquatsibtian.com That represents the largest monthly increase in payrolls since January. The unemployment rate is 3.8 percent, and while the third quarter GDP report is still three weeks away, the median estimate from Blue Chip Economic Indicators for Q3 real GDP growth is around three percent. colegiogalvarino.cl ppid.pnk.ac.id The Atlanta Fed’s GDPNow indicator predicts 4.9 percent growth. Make of it what you will, but those numbers are not exactly screaming recession.Good News Is Bad News

Today’s report was just one of three readings of the labor market that came out this week. A Tuesday report (also from the BLS) showed a much higher than expected number of job vacancies, followed on Wednesday by a survey from the ADP Research Institute suggesting that job creation was slowing down. As went the reports, so went the bond market. The yield on the 10-year Treasury note surged on Tuesday in response to the optimistic job vacancies report, then subsided on Wednesday with the cooler ADP survey. Yields are, predictably, soaring again today on the heels of those 336K payroll gains. The 10-year is now nearly on par with the 3-year and closing in on the 2-year, more than a year after the yield curve began its inversion in July last year.

What’s good for the economy (more jobs) is treated as bad news by the market because it solidifies the view that interest rates are going to stay higher for longer. That is why we once again have the unusual positive correlation between stocks and bonds (remember that bond prices move in the opposite direction from bond yields, so this week’s surge in yields has meant falling bond prices). The normal state of things is for investors to move into bonds when seeking safety amid uncertainty, and to toss off bonds in favor of stocks when animal spirits are feisty. A strong economy should be a catalyst for shifting the portfolio allocation weights towards more equities. But when the strong economy is seen as the rationale for a more sustained period of high interest rates, the math works out differently, as this week’s parallel trend in bonds and stocks demonstrates.

Bond Vigilantes

Way back in the early 1980s an economist named Edward Yardeni coined the phrase “bond vigilantes” to describe how bond investors drive up interest rates when they have no confidence in the direction of US fiscal and monetary policy. Yardeni resurrected that phrase in a Financial Times article earlier this week, noting that a combination of lower tax revenues, higher Treasury outlays on debt servicing and increased government spending could lead to another spell of vigilante-ism in the bond market. That, in turn, could keep interest rates higher even after the Fed ends its monetary tightening, bringing about a genuine credit crunch. Eventually, under that scenario, a recession would likely be unavoidable.

Which brings us back to the question we posed at the opening of this article: does anybody actually know what’s happening in the economy? The Fed sees a soft landing as increasingly likely, the bond vigilantes see things going off the rails, and all the while companies still seem to be throwing their doors wide open to bring in new hires. It’s a confusing picture. There are plenty of things for the market to worry about, but there are also plenty of reasons for confidence, a strong labor market and continued GDP growth being among them. Our advice is to be prepared for surprises, but stay disciplined and avoid decisions based on emotional reactions to short-term developments. This, too, will pass.

MV Weekly Market Flash: A Brief History of Markets and Shutdowns

The US stock market has been in one of those glass-half-empty moods for some weeks now, down nearly seven percent from the year-to-date high reached on July 31. There are several objects in the grab bag of negative news offered by the financial press to explain Mr. Market’s current malaise, one of them being the seemingly inevitable government shutdown about to happen. Given that the shutdown technically goes into effect on Sunday night (unless Congress has a magic trick to reveal that nobody has seen yet), this would seem to be a good time to take a closer look at the past history of shutdowns and the market.

Less Often Than You Think

This being the Washington, DC metro area, shutdowns are a pretty big deal (and an unpleasant one) for many of our fellow citizens who call the DMV home. In the course of casual conversations we often hear something to the effect of “yeah, these things happen all the time.” Do they, though? Well, the federal government has technically shut down 14 times since the beginning of the Reagan Administration. The vast majority of these shutdowns, though, lasted between just one and three days. There was a one-day shutdown in 1982 that happened for the sole reason that the leading figures in both the Republican and Democratic Parties had social functions that day that prevented them from the work needed to keep the government open (there is a memorable photograph of President Reagan being serenaded by Tammy Wynette during a barbecue on the South Lawn on the evening the shutdown was going into effect).

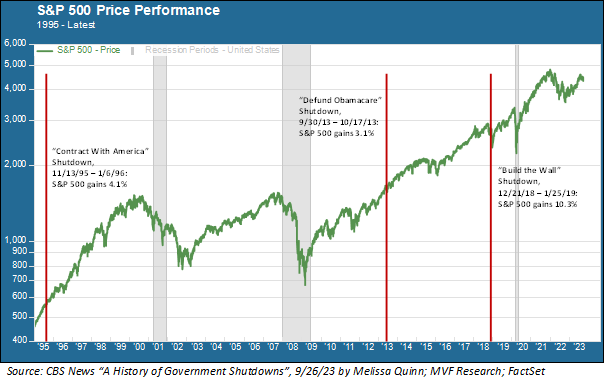
On only three occasions did the shutdown persist for more than three days. On none of these three occasions did the shutdown have any apparent effect on the stock market. Here’s a chart with the data.

Performance and Capitulation

The three shutdowns that persisted for more than a week were, for the most part, unwinnable ideological battles waged more for theatrical posturing than any real hope of achieving something. In November 1995 the Republican Congress under Speaker Newt Gingrich, flush with success after their sweeping victories in the 1994 midterms, pushed for the inclusion of their so-called Contract With America into budget discussions. These included repeal of the Clinton Administration’s 1993 tax increases and a balanced budget amendment. The parties briefly agreed after five days to fund the government while negotiations continued, but this agreement fell apart in December and the shutdown persisted for another 21 days. Public opinion swung against the Republican-led Congress, which finally backed down and ended the standoff. Meanwhile the stock market yawned, paid more attention to other things going on at the time and ended up 4.1 percent higher at the end of the standoff.

The 1995 template pretty much played out in similar fashion during the other two multi-week standoffs. In 2013 the Republican Congress pushed to dismantle key provisions of the Affordable Care Act, one of the signature policy accomplishments of the Obama Administration. Once again the drama was Kabuki-like in its flashiness without much substance. The standoff lasted for 16 days until Speaker John Boehner’s patience with his own team ran out and a spending bill was passed with no impact on Obamacare. Once again the stock market basically ignored the drama and continued what was already a very up year, gaining 3.1 percent during the shutdown for reasons utterly unrelated to it.

The longest shutdown to date happened at the end of 2018, the dispute this time centering on the Trump administration’s objections to a Senate appropriations bill that did not include $5.7 billion in funding for the border wall that was one of the administration’s constant talking points. Lots of political jiu-jitsu from all sides kept the shutdown dragging on until the administration agreed to a stopgap bill on January 25 that reopened the government. This time, the S&P 500’s gain of 10.3 percent really had nothing whatsoever to do with Congress or the White House, and everything to do with the Fed. The central bank had pivoted on its monetary tightening program, pausing rate hikes in December amid a near-bear market in stocks. The S&P 500 bottomed out just two days after the government shutdown began and soared through January as investors cheered the Fed’s pivot.

What About This Time?

So that’s the history. What about this time? Are there reasons to believe that this shutdown (assuming it happens) is going to be of a magnitude or more different from the previous occasions? Well, the Kabuki element is certainly there. Once again, it seems like ideologically-tinged performative politics is driving the bus. The public, we believe, has a certain reserve of resigned tolerance for these theatrics, but at some point not very long from now, the tolerance will wear off. At least for now, our take on things is that the shutdown will resolve itself through whatever arcane mechanics the key players come up with this time, allowing everyone to save a little face and sate their voting base back home with clickable outtakes. We will of course be monitoring events as they transpire. And we are dismayed that once again the dysfunctions of our political leaders are on public display for the world to see – but such are the times in which we live. Here’s hoping that public pressure will kick in and bring the antics to an end sooner rather than later.

MV Weekly Market Flash: Wild Times For Safe(?) Assets

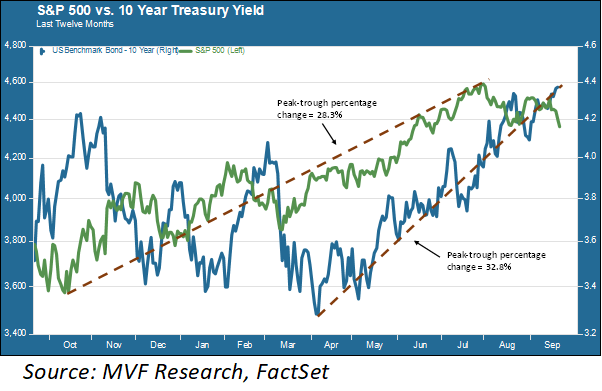
Bonds for safety and equity for growth – this is the basic formula for long-term investment planning, the essence of portfolio construction around a client’s specific return objectives and risk tolerance. With that formula in mind, take a look at the chart below. Without looking at the labels, which one of the two price performance lines would you think represents a common stock index, and which depicts the yield for 10-year Treasury securities?

You would intuitively think that the line that moves with less up-and-down variance would be the one representing the safer asset – the one used as a proxy for the “risk-free asset” of financial valuation theory. Not here, though. The blue line shows us how the 10-year Treasury yield has moved from day to day over the last twelve months, which period includes a percentage change of 32.8 percent from its low point back in March to the high (thus far) reached yesterday. By contrast, the change for the S&P 500 stock index, in green, is just 28.3 percent from last October’s low to this year’s high point reached in July.  You can also see more pronounced short-term volatility swings in the Treasury yield than in the stock price index – in fact, the average daily percentage change in the Treasury yield is almost twice the average percentage gain or loss in stock prices (1.54 percent to 0.79 percent).

The Price of Money

Admittedly, we don’t intuitively think about bond yields in the same way we do about stock prices. If the yield on the 10-year Treasury note goes from, say, 4.245 percent to 4.33 percent – well, nobody’s going to breathlessly report that on the CNBC daily market wrap-up. In terms of a percentage movement, though, that change from 4.245 to 4.33 represents a magnitude of two percent (4.25 x 1.02 = 4.33). If, on the other hand, the Dow Jones Industrial Average goes up or down by two percent on a given day, that’s a newsmaker. It’s a gain or loss of around 690 points at current Dow levels – hundreds of points! Here is one of those behavioral traps of which the financial world has plenty. Since bond yields are already expressed as percentages, it’s hard for the brain to do the math to accurately express a change in yields in percentage terms, whereas it’s easy for the brain to register “690 points” as a big deal (which is a major reason why financial news reporters love to report on the doings of the Dow).

But a bond yield is also a price – it’s the price of money, a market price agreed to between buyers and sellers of credit. And US Treasury securities are arguably the world’s most important publicly traded asset. So it’s worth paying attention to those movements in Treasury yields and asking why they go up and down as much as they have been in the last year.

Getting It Wrong, All Year Long

One reason why yields on the so-called risk-free asset have been bouncing around so much this year is that the bond market spent much of the first half of the year adamantly refusing to believe that the Fed was going to keep interest rates higher for longer – even though Jay Powell and his colleagues literally said “higher for longer” every time the subject came up in their interactions with the public. Back in early March, when the collapse of Silicon Valley Bank and a couple other financial institutions raised fears of a general banking crisis, bond traders bid Treasury yields way down as expectations rose that the Fed would actually start immediately cutting – yes, cutting – interest rates. Those sub-3.4 percent yields you see on the 10-year note in the above chart reflected a consensus pricing in of at least two rate cuts in 2023.

Well, it’s almost October 2023, and the only thing that has happened since March has been more rate increases and – if the Federal Open Market Committee is to be believed from its Summary Economic Projections reached this week – one more to come at either the November or December FOMC meeting. The collective wisdom of the market simply got it wrong, and kept getting it wrong, for a good part of this year. Many of those sharp spikes in the 10-year yield you see in the above chart coincide with the dates of FOMC meetings. Reporters at the post-meeting press conference would try to goad Powell into saying something about rate cuts, Powell would push back hard and say “higher for longer,” yields would shoot up and then fall back down again as bond traders talked themselves back into believing that there really was a rate cut pony out back.

It’s taken awhile, but it seems that this past week’s FOMC meeting may have finally cemented the message into the bond market’s collective head. Perhaps there will be fewer of those wild stock market-like swings up and down going forward. The good news to be found here is that, with the economy’s performance so far this year exceeding the expectations of most economists, including those of Powell and his Fed colleagues, the danger of “higher for longer” triggering a recession is substantially lower than it was earlier in the year. If the Fed can actually pull off a soft landing while bringing inflation back to target levels, that should be a net positive for asset markets in general. Which would be nice, because there will be plenty of other challenges to deal with in 2024.

MV Weekly Market Flash: Oil, Inflation and Consumers

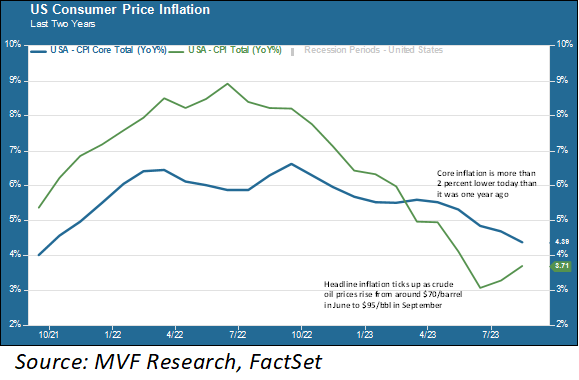
The Federal Open Market Committee will meet next week to determine whether to raise interest rates again. The broad consensus among those who pay attention to the FOMC’s doings is that they will not raise rates. The inflation measure the Fed pays attention to is more than two percent lower today than it was in September last year (4.39 percent compared to 6.64 percent, expressed on a year-on-year basis). That’s still more than two percent higher than where the Fed wants inflation to be, but it has been moving steadily in the right direction. Holding rates higher for longer will eventually get consumer prices back down to that two percent target level – that is what we expect to hear from Jay Powell next week.

Consumers Have Some Thoughts

So, about that inflation measure the Fed watches: it’s not the same one that we, the good American citizens and consumers that we are, have in mind as we go about our daily lives. It will likely come as no surprise to anyone reading this that gas prices are up, and up by a lot from where they were earlier this year. The price of gasoline is not included in so-called core inflation, which is what drives Fed deliberations on interest rates. Nor, for that matter, are food prices. So the two things that figure most directly into our weekly household spending are not part of the inflation equation that dominates the FOMC’s cogitating. And right now, these two different perceptions of inflation are moving in different directions.

Demand High, Supply Low

Typically, gas prices start to come down in late summer as vacationers return home and demand starts to fall. But prices at the pump started rising in a meaningful way in early July and have kept rising through and past the Labor Day weekend. While demand has remained somewhat higher than usual, the main reason for the spike in gas prices is that concerted supply cuts by Saudi Arabia and Russia have pushed crude oil prices to more than thirty percent higher today than they were in late June. The production cuts were initially announced to be a temporary measure, but this past week the Saudis and Russians confirmed that the production cuts would remain in place until at least the end of this year. That means about 1.3 million fewer barrels of oil per day than would be the case without the production cuts. This at a time when global demand for crude oil is set to reach a record 109 million bbl/day this year, thanks in large part to better economic growth than most economists expected at the beginning of the year.

The Expectations Game

Notwithstanding the Fed’s focus on core inflation, we expect there will be some discussion in the Eccles Building next week about gas prices – specifically, on the potential effect of continued higher prices on household inflation expectations. Inflation in large part is a game of expectations – households and businesses will shape their spending decisions around what they think prices will be next month and next year. This becomes a problem when expectations for higher inflation turn into a feedback loop. Businesses raise prices, workers demand higher wages and a wage-price spiral ensues.

So far this has not happened. According to this month’s University of Michigan Survey of Consumers, inflation expectations are in fact lower today than they were a month ago, with consumers expecting headline inflation (i.e., including those volatile food and energy categories) to be 3.1 percent a year from now. That’s down from the 3.5 percent one-year-forward expectation the consumers had in August.

Those expectations could change, though, if gas prices keep going up. If expectations for higher inflation become entrenched, it stops being a “headline inflation” problem and becomes a “core inflation” problem – and thus a problem for the FOMC and its interest rate decisions. For now, we are of the same mind as the broad consensus in expecting the Fed to wrap up on Wednesday without raising rates again. It wouldn’t hurt, though, to start seeing some lower numbers as we drive past those gas station signs on our way to and from work.

MV Weekly Market Flash: Petulant China

This should be the best of times for Apple, the world’s most valuable company with a $2.8 trillion market capitalization. The company is ever so close to knocking rival Samsung off its perch as the leading seller by volume of smartphones. Next week will see the launch of the iPhone 15, the company’s newest model, along with all the overcaffeinated hype that accompanies any Apple new product launch. And even in an environment where overall smartphone sales by unit are set to decline for a second consecutive year, Apple continues to set revenue records in its Services segment, which includes video, music, payment services, healthcare and cloud.

Leave Those Phones At Home

But this week saw Apple lose about $190 billion from that $2.8 trillion market cap. It should be noted here that $190 billion is more than the total current market cap of all but 36 companies on the S&P 500, and roughly the same size as streaming giant Netflix or Big Pharma leader Pfizer (for Apple it was a mere loss of six percent).

The proximate cause of this reversal of fortune, like so much other bad news of late, was China. Specifically, an apparent edict from somewhere high up in Beijing leadership circles banning the use of iPhones and other Apple products for public officials in their offices. China is one of Apple’s biggest markets, and relations between the country and the company have always been, or at least seemed to be, excellent. A crackdown on the use of iPhones, iPads and the like in state-owned facilities (which can include government agencies, state-owned enterprises, research centers, hospitals and a great deal more) could be very bad news indeed. It could also be a tempest in a teapot – as of yet there has been no official word either from anyone in China or from Apple about this apparent ban. But will be a matter of concern to a great many other US companies for whom China is a major contributor to their total sales.

Nothing To See Here, Go Away

The Apple story is just the latest in a series of developments that seems to reflect an unsettling petulance among China’s leaders. Last month the country quietly stopped reporting data on youth unemployment, which economists estimate to be well in excess of twenty percent. Even as the government tries to put window-dressing on the mounting problems in the property sector (for example, coming up with the means for Country Garden, a very large and very troubled developer, to make two bond payments and thus temporarily stave off technical default), nothing suggests a near-term solution for an industry sector that contributes more than a quarter of total gross domestic product. In a recent article in Foreign Affairs magazine Adam Posen, President of the Peterson Institute for International Economics, argued that China is suffering from “economic long Covid” – likening the country’s worsening economic condition to the chronic health problems suffered by patients whose Covid symptoms persist for months or years.

In the authoritarian playbook, the best way to solve problems is to cover them up – thus the cessation of reports about youth unemployment, thus the attempt to divert attention away from problems in the property sector, and thus – possibly – the attempt to reshape domestic consumer demand away from the popular products from the West that have become staples of daily life, be they iPhones or Starbucks lattes or Nike sneakers. It is perhaps not a coincidence that news about the purported Apple ban happened at the same time that Huawei, the Chinese phone maker burdened by a slew of Western sanctions, announced a new leading-edge phone that has outsiders wondering where the latest-generation semiconductor technology the phone appears to have came from.

Meanwhile, though, the numbers that do manage to get reported keep telling the same story. Exports declined in August for a fourth straight month, the Chinese yuan is trading at its lowest level versus the US dollar in sixteen years, wages are stagnant and property values – that linchpin of economic growth – seem to have nowhere to go but down. We will be listening very carefully to what the management teams of China-intensive US companies that we track have to say about their business prospects there when the next earnings season comes around next month.

MV Financial

Meet Our Team

Smart Strategies.

Investment Advisor Company