Meet Our Team
MV Weekly Market Flash: Not The Cruellest Month, Perhaps
MV Weekly Market Flash: The Trade Winds Theory of Markets
MV Weekly Market Flash: It’s Wyoming Week Again
MV Weekly Market Flash: A Deflating Week for China
MV Weekly Market Flash: Yields Rise for (Mostly) Non-Downgrade Reasons
MV Weekly Market Flash: End of the Cycle?
MV Weekly Market Flash: High Bar for Tech Earnings
MV Weekly Market Flash: International Equities Had a Minute, Until They Didn’t
MV Weekly Market Flash: Bonds in Wonderland
MV Weekly Market Flash: A Pretty Resilient First Half for US Equities

MV Weekly Market Flash: Not The Cruellest Month, Perhaps

Read More From MV

April is the cruellest month, according to T.S. Eliot in the opening line of “The Waste Land.” Investors would beg to differ and point instead to September, which historically has been the worst-performing calendar month of the year for US equities. The S&P 500 posted losses in each of the past three Septembers: minus 9.3 percent in 2022, minus 4.8 percent in 2021 and minus 3.9 percent in 2020. Well, today being the first day of September, it seems like a good time to ponder what might happen in the month ahead. We think there are some good reasons to...

Read More

MV Weekly Market Flash: The Trade Winds Theory of Markets

Read More From MV

The financial news media likes nothing more than an easy story. Stocks (or bonds) were up (or down) today because of X, X being the single event of the day to describe why the market did what it did. Every so often, that approach works. On September 15, 2008 the S&P 500 fell by 4.7 percent, a giant move for a single day. September 15 was also the day that investment bank Lehman Brothers declared bankruptcy. It was pretty much on target that day to report that “stocks fell by almost five percent because a giant securities firm failed and...

Read More

MV Weekly Market Flash: It’s Wyoming Week Again

Read More From MV

Every year, for one week in August, our eyes turn to the great state of Wyoming and the delightful resort of Jackson Hole. hotellaboheme.ro There, the great and the good from the world’s major central banks gather to hash out the issues of the day and chart a course for monetary policy in the years ahead. The Jackson Hole meetings come at a particularly poignant time this year, because there is a great deal going on in securities markets and the economy at large. alghalyacar.com We don’t expect there will be much time for the bankers to enjoy the recreational...

Read More

MV Weekly Market Flash: A Deflating Week for China

Read More From MV

We have been in this business long enough to remember all the “Japan as Number One” mania of the 1980s. Those were the days when straight-faced financial reporters informed us that the three square miles of the Imperial Palace grounds in downtown Tokyo were worth more than the entire state of California (yes, really). All that nonsense ended on December 29, 1989, the last trading day of that decade, when the Nikkei 225 stock index hit an all-time high of 38,915. Thirty-three years and change later, that is still the all-time high for the Nikkei index, which closed out the...

Read More

MV Weekly Market Flash: Yields Rise for (Mostly) Non-Downgrade Reasons

Read More From MV

A strange thing happened when we came into work on Wednesday morning this week and plugged into the daily news cycle: we learned, as the rest of the world was learning, that the credit rating agency Fitch Ratings, something of a third wheel to the more well-known Standard & Poor’s and Moody’s, had issued a downgrade on US government debt. Fitch was of course the second US rating agency to deprive Treasury securities of the coveted triple-A rating, fully twelve years after the S&P shock downgrade took place in August 2011. This was not telegraphed in any meaningful way, nor...

Read More

MV Weekly Market Flash: End of the Cycle?

Read More From MV

It may be, or it may not be, the last time the Fed raises interest rates in the monetary tightening cycle that began in March 2022. After Wednesday’s FOMC meeting, when the Committee voted unanimously to raise rates by another 0.25 percent, we figured the likelihood of another hike at the next meeting, in September, was more or less a coin flip. Then came the second quarter GDP report on Thursday, showing that the US economy grew by 2.4 percent (annualized) from the first quarter, a much stronger showing than expected. Then came this morning’s Personal Consumption Expenditures report, the...

Read More

MV Weekly Market Flash: High Bar for Tech Earnings

Read More From MV

There are many currents afoot in equity markets these days, and not all of them are moving in the same direction. We noted in one of our recent commentaries that the very narrow leadership of a small number of mega cap tech stocks seemed to be broadening out to other corners of the market. It’s a good time to revisit this idea, partly because earnings reports for those Big Tech names are starting to come out, and partly because it remains unclear what alternative themes (if any) might replace the “Magnificent Seven” narrative that drove the lion’s share of those...

Read More

MV Weekly Market Flash: International Equities Had a Minute, Until They Didn’t

Read More From MV

We wrap up our mid-year review of recent asset price trends with a look at non-US equities. This is a topic on which we periodically get some pushback, notably for the fact that we have been very underweight these asset classes (international developed and emerging markets equities) for quite some time now. After all, the foundational rule of modern portfolio theory as originally put forth by Harry Markowitz back in his 1952 paper on portfolio selection is diversification – distinct asset classes that do different things at different times (i.e., low correlation with other assets in the portfolio) so as...

Read More

MV Weekly Market Flash: Bonds in Wonderland

Read More From MV

We continue this week with our review of 2023 at the halfway mark, today’s focus being the very strange world of fixed income. You know the mantra because you’ve heard it from us thousands of times: bonds for safety, equities for growth. We expect that will still be true in the long run, but the bond market has not been anything like an oasis of calm so far this year. The Great Mispricing Fixed income markets had been volatile before the sudden collapse of Silicon Valley Bank in early March set off a mini-panic about the stability of the banking...

Read More

MV Weekly Market Flash: A Pretty Resilient First Half for US Equities

Read More From MV

Well, here we are already, halfway through the 2023 marathon. It’s the time of year when we go back,  re-read the opinions we shared with you in our annual outlook in January, see what we got right and wrong, and adjust our outlook based on what we know now. As Yogi Berra said, it’s hard to predict things, especially when it’s about the future. In our commentary this week we will take a close look at US equities. Next week ‘s focus will be on the bond market, and following that we will consider the case of non-US developed and...

Read More
MV Weekly Market Flash: Not The Cruellest Month, Perhaps

April is the cruellest month, according to T.S. Eliot in the opening line of “The Waste Land.” Investors would beg to differ and point instead to September, which historically has been the worst-performing calendar month of the year for US equities. The S&P 500 posted losses in each of the past three Septembers: minus 9.3 percent in 2022, minus 4.8 percent in 2021 and minus 3.9 percent in 2020. Well, today being the first day of September, it seems like a good time to ponder what might happen in the month ahead. We think there are some good reasons to not fret too much about what the “average” September looks like and to focus more on the specific factors that may be at play this year.

Jobs and a Rate Reprieve

This past week saw US stocks recover a decent chunk of their August losses; the S&P 500 gained 2.3 percent from last Friday’s close through yesterday, leaving the index down by 1.8 percent for the full month. The big sentiment driver this week was moderation in the jobs market. A report on Tuesday showed job vacancies at their lowest level in two years. That was followed on Wednesday by the ADP Employment Survey posting payroll gains of 177,000, below the 200,000 expected. Finally, this morning’s employment report from the Bureau of Labor Statistics showed payroll gains of 187,000, a rise in the unemployment rate to 3.8 percent and an increase in the labor participation rate to 62.8 percent. That was the first meaningful rise in the participation rate since March, and probably explains much of the increase in the unemployment rate – more people as a percentage of the population at large are actively looking for jobs. That is a good thing.

What the market was looking for in the jobs data was some consistency in a pattern of slowing – but slowing at a pace that suggests “soft landing” rather than “recession.” All three of this week’s key reports showed precisely that, and the bond market responded with a significant drop in yields from recent highs. The 10-year Treasury yield just last week had reached its highest level since 2007. This week the 10-year basically gave up all its August gains and is currently at 4.08 percent, roughly where it started the month. Unsurprisingly, the reprieve in rates lit a fire under the growthier corners of the stock market, led once again by enthusiasm for anything AI.

No Two Septembers Are Alike

So is all this soft landing-supportive jobs data enough to not worry about another cruel September? Only time will tell – as we always say, the short term is essentially unknowable. But our base case outlook is pretty benign. We will get the August CPI report on September 13 and will be looking for month-on-month numbers for core CPI to be roughly commensurate with July’s 0.2 percent gain (which is also what the July PCE, a different inflation measure closely watched by the Fed, showed when that report came out earlier this week). That, plus the moderately slowing jobs data, should be enough to validate the current consensus expectation that the Fed will hold rates steady without a further increase when the FOMC meets on September 20. There are of course other factors out there to keep an eye on. The resilience of consumer spending has been called into question a bit this week with some equivocating forward guidance provided by retail companies in their quarterly earnings commentaries.

On balance, though, we do not see too much in the way of red flags that would argue for a more defensive position in equities heading into the remaining months of the year. Three or four months ago we would not have been described as believers in the soft landing scenario, but the data today seem to be telling us differently. Remember – it’s not what happens in the “average” September that matters, but what all the factors at play mean for what happens this particular September. So far, at least, so good.

MV Weekly Market Flash: The Trade Winds Theory of Markets

The financial news media likes nothing more than an easy story. Stocks (or bonds) were up (or down) today because of X, X being the single event of the day to describe why the market did what it did. Every so often, that approach works. On September 15, 2008 the S&P 500 fell by 4.7 percent, a giant move for a single day. September 15 was also the day that investment bank Lehman Brothers declared bankruptcy. It was pretty much on target that day to report that “stocks fell by almost five percent because a giant securities firm failed and all sorts of collateral damage is probably going to come to the surface.”

Most days, though, come and go without the failure of systemically critical financial firms or other commensurately earth-shaking events. On most days, hundreds of potentially market-influencing events blow this way and that, like trade winds crisscrossing each other on the open sea. Like the waves created by the trade winds, these events more often cancel each other out than move collectively in a single direction. This is a particular problem for momentum trading strategies, which have had a rough time of things in 2023. An article in the Financial Times newspaper today noted that trend-following hedge funds this year have been sideswiped by a number of developments their high-powered algorithms didn’t see coming in the markets for equities, fixed income and commodities alike.

We thought this week would be a good time to revisit our “trade winds theory” of markets, because we have some fresh material to provide as an illustration. Recall that one of the big trend themes of 2023 thus far – arguably the biggest single theme in US equity markets – has been AI mania. All things artificial intelligence has been the big story ever since financial journalists started playing around with ChatGPT last November and sharing their amazement on Twitter, as journalists always do. A very small number of companies are central to the AI story, and they have done phenomenally well this year. One of those companies, Nvidia – a designer and manufacturer of graphics processors – saw its shares rise nearly 25 percent in a single day back on May 25 when it reported quarterly sales and earnings that blew away analyst expectations, thanks to overwhelming demand for its considerable AI capabilities.

Nvidia reported quarterly earnings again on Wednesday this week, and once again the report was stellar from just about every conceivable standpoint – well ahead of analyst expectations for the quarter past, a significant raise in guidance for the quarter ahead, and even a $25 billion share buyback as icing on the cake. This report came out after Wednesday’s market close, and shares in aftermarket trading popped immediately. In other words, the stage was set for a corker of a rally on Thursday favoring all the AI-adjacent asset classes and themes – semiconductors, growth stocks in general, the Nasdaq Composite.

For about fifteen minutes or so on Thursday, that expectation seemed to be playing out. On CNBC the talking heads were rehearsing what they fully expected would be their end-of-day wrap-up: “Stocks soared, with tech stocks leading the way on blowout earnings from Nvidia.” But then those darned trade winds came in from other directions. Earnings reports from consumer retail companies have also been coming in this week, with some concerns about pricing power, margins and demand weakness. Tensions grew about what Jay Powell might say about interest rates at the Fed’s Jackson Hole symposium on Friday. Durable orders were a bit worse than expected, Germany’s manufacturing sector is in the doldrums – winds blowing in all sorts of different directions.

At the end of the day, Nvidia shares were more or less flat, but the Nasdaq Composite was down nearly two percent and the S&P 500 lost more than a percent. There was momentum, in other words, but not the momentum that the algorithms or the financial reporters expected. As we write this on Friday mid-morning, shares generally seem to be under further pressure as the market digests a somewhat (though not unduly) hawkish speech from Powell in Wyoming, and a closely watched University of Michigan consumer sentiment report suggesting that one- and five-year inflationary expectations rose (despite a recent downtrend in both headline and core inflation).

Such is the unpredictable nature of the trade winds on any given day. Our message to our clients is always the same: you can’t know what is going to happen in the short term (and even if you did know what was going to happen, you would not be able to predict how the market is going to react). Markets usually do not close up or down on any given day “because of X” – excepting those rare days when things like systemically critical financial firms go bankrupt, and thankfully those really are few and far between. Focus on your long-term financial goals, and stay disciplined and patient while the trade winds blow this way and that.

MV Weekly Market Flash: It’s Wyoming Week Again

Every year, for one week in August, our eyes turn to the great state of Wyoming and the delightful resort of Jackson Hole. hotellaboheme.ro There, the great and the good from the world’s major central banks gather to hash out the issues of the day and chart a course for monetary policy in the years ahead. The Jackson Hole meetings come at a particularly poignant time this year, because there is a great deal going on in securities markets and the economy at large. alghalyacar.com We don’t expect there will be much time for the bankers to enjoy the recreational offerings on hand, but at least they will have the spectacular views of the Grand Tetons for inspiration while they try and figure out how to stick the landing on beating back inflation while avoiding a protracted global recession. demo.youaddon.comGrowth and the Great Repricing

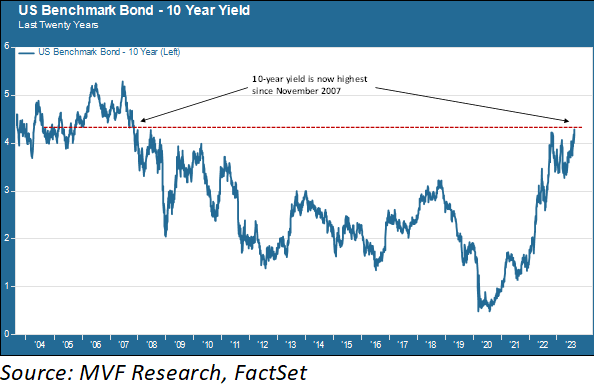
It took more than a year, but it finally seems to have sunk into the collective brain of the investor class that “higher for longer” – the mantra the Fed has been repeating all this time – is actual policy. Fed chair Powell, whose keynote address next week will be the main draw for Jackson Hole proceedings, is unlikely to spell out what the FOMC is likely to do when it meets next in September. But he may give some hints as to how the Fed is digesting a string of economic reports suggesting that the economy is doing better than just about anyone had expected earlier this year. The rosier outlook is making itself felt in the bond market, where the nominal 10-year Treasury yield is now at levels last seen in 2007.

Here’s where this gets complicated. For more than a year now, the Treasury yield curve has been inverted, with short-term rates well above intermediate- and long-term rates. An inverted yield curve is normally a reflection of an expected recession – a theme we have discussed on many occasions this year. Now, however, it appears much less likely that a recession is in the cards for 2023, or possibly at all. That, of course, would be good news for American households and businesses. For the bond market though – not to mention the stock market, which is also directly impacted by interest rates – the news is a bit more mixed. A stronger economy implies fewer job losses, which gives the Fed more room to contemplate its interest rate moves without worrying about the potential effects on the labor market (remember that the Fed has a dual mandate to maintain stable prices and promote maximal employment). That lends more weight to the “higher for longer” policy, which is probably why the expectation of short-term rates not coming down below five percent any time soon seems to finally be conventional bond market wisdom.

But what does that imply for the near-term direction of intermediate and long-term rates? If (a) there is a low likelihood of recession and (b) short-term rates are going to stay anchored in the low-mid five percent range, are we potentially looking at the 10-year creeping back up over five percent or even higher? It’s not an impossible scenario. In the second half of the 1990s, a period of strong real GDP growth and low inflation, 10-year nominal yields fluctuated between six and seven percent for much of the time. The past fifteen years of abnormally low rates notwithstanding, there’s nothing to say it couldn’t happen again.

Curb Your Enthusiasm

That being said, we do not think a return to 1990s-era intermediate rates is a likely near-term scenario, nor do we think that the absence of a recession, if we are lucky enough to avoid one, means a return to ‘90s-era strong growth. In a report published this week, the San Francisco Fed projected that the excess household savings accumulated during the pandemic is likely to be fully played out by the end of the third quarter (which is just a month and a half away). This dynamic is something we focused on in our annual outlook way back in January as a key data point suggesting a slowdown. While we have been pleasantly surprised by the better-than-expected trends in consumer spending and business investment since then, we still expect that the drawdown in savings, along with persistently high levels of consumer debt, will act as constraints on growth levels.

The much-hoped for “soft landing” at the end of the Fed’s monetary tightening, as we interpret it, means sub-two percent real GDP growth, a modest level of payroll gains and a likewise-modest level of wage growth (it also should mean that inflation continues its slow retreat back towards pre-2021 levels). In the very near term we could see intermediate rates rising a bit further, particularly if we get a strong Q3 GDP report as some economists are now forecasting, along with a couple more months of strong jobs reports. But we also expect conditions to settle into the slower-growth phase as the end of the year approaches, which should take some pressure off rates. That’s our view, anyway – we’ll see what Jay Powell and his fellow central bankers have to say about it next week in Wyoming.

MV Weekly Market Flash: A Deflating Week for China

We have been in this business long enough to remember all the “Japan as Number One” mania of the 1980s. Those were the days when straight-faced financial reporters informed us that the three square miles of the Imperial Palace grounds in downtown Tokyo were worth more than the entire state of California (yes, really). All that nonsense ended on December 29, 1989, the last trading day of that decade, when the Nikkei 225 stock index hit an all-time high of 38,915. Thirty-three years and change later, that is still the all-time high for the Nikkei index, which closed out the current week at 32,475, still more than 16 percent down from the 1989 peak.

Exports, Property and Prices

We are not going to try and make the case that China’s situation in 2023 is a repeat of Japan’s in the early 1990son. But there are some similarities that are worth paying attention to. This week served up a handful of economic reports that called a few of these similarities to mind. On Tuesday we learned that China’s exports fell by 14.5% from a year earlier, a bigger than expected drop and a reminder that China is no longer the export powerhouse that it was in the early years of the twenty-first century.

That same report also showed a double-digit drop in imports, which highlights another current weakness in the Chinese economy: consumer demand. When Beijing lifted the austere zero-Covid restrictions in November last year there were widespread expectations of a consumer-led boom in demand for goods and services. That boom has largely failed to materialize. Retail sales in recent months have also been muted. China’s economic policymakers have for many years been trying to rebalance economic output to a more consumer-focused model; so far, those attempts have largely fallen flat.

What has until recently driven much of China’s growth has been its property and infrastructure sector, and another report this week reminded us why this is an ongoing problem. Country Garden, the country’s largest private property developer, missed interest payments of $22.5 million on two international bonds. Country Garden was supposed to be proof positive that the property sector had overcome its recent troubles; instead, the missed interest payments set up the potential for yet another prominent default, fully two years after the Evergrande collapse in 2021 set the unwinding of this sector – which contributes around 30 percent of China’s GDP growth – in motion.

Finally, prices at both the consumer and the wholesale level are deflating in China, even while most of the world’s other major economies continue to work at bringing down inflation. Deflation is a natural outcome of the problems reflected in those other reports – weak consumer demand, lackluster exports and a property market stuck in reverse. In many ways, deflation is a worse condition than too-high inflation, because it encourages hoarding at both the household and business levels and sets the stage for a years-long downward spiral. This, indeed, is what Japan experienced in the 1990s when its own property sector went bust, overextended banks stopped lending and households stopped spending.

Beijing’s Long Game

For all the similarities, though, China in 2023 is not Japan in 1990. For one thing, Beijing does have a specific strategy for long-term growth, something that cannot be said about Japan’s policy mandarins at the Ministry of Finance in the 1990s as they circled the wagons around their failing financial sector. China’s strategy has two key components: first, consolidate its position as the dominant supplier of the raw materials needed for transition to clean energy; and second, invest heavily in forward-leaning sectors including biotechnology, quantum computing, artificial intelligence and semiconductors.

This strategy may or may not work. In semiconductors, for example, China’s domestic capabilities are far behind those of leading centers of excellence elsewhere, including Taiwan, Japan and the US. The geopolitical climate is uncertain, to say the least. And it is entirely unknown whether there would ever be enough practical use cases in areas like AI and quantum computing to offset the ongoing decline in the erstwhile growth engines of property and infrastructure. That being said, there is a definite logic to the strategy, and it would be a mistake to ignore its potential for success one day. In our view, however, that day is not today.

MV Weekly Market Flash: Yields Rise for (Mostly) Non-Downgrade Reasons

A strange thing happened when we came into work on Wednesday morning this week and plugged into the daily news cycle: we learned, as the rest of the world was learning, that the credit rating agency Fitch Ratings, something of a third wheel to the more well-known Standard & Poor’s and Moody’s, had issued a downgrade on US government debt. Fitch was of course the second US rating agency to deprive Treasury securities of the coveted triple-A rating, fully twelve years after the S&P shock downgrade took place in August 2011. This was not telegraphed in any meaningful way, nor did there seem to be any news of the moment to warrant the timing. Fears of a major market swoon, though, were brief and mercifully shallow.

2011 This Is Not

For a quick refresher on that turbulent summer of 2011: Congress and the White House were locked in an implacable standoff over the debt ceiling for most of the summer, finally cobbling together an agreement to raise the debt ceiling (subject to all sorts of conditions that would come back to bite a couple months later) on August 2 of that year. On August 5, a Friday, S&P published the report downgrading Treasuries to AA+ status. The following Monday, August 8, the S&P 500 stock index plunged seven percent in a single day. The total damage to US stocks during this period would amount to about 19 percent from peak to trough, just shy of the threshold for a bear market.

Oh, and while all this was going on, the single-currency Eurozone was in the middle of its own crisis with the future of four of its members – Greece, Italy, Portugal and Spain – very much in doubt.

The market reaction to this week’s Fitch downgrade was a few magnitudes less dramatic than 2011. Stocks retreated on Wednesday, with the S&P 500 falling 1.4 percent and the Nasdaq Composite dropping 2.2 percent. But if the Fitch downgrade had anything to do with that, it would seem to be more along the lines of providing an excuse for investors who were looking for a reason to sell and book some profits from the market’s recent rally. Overall market sentiment continues to be more focused on the direction of the economy (better than expected) and corporate earnings (decent, but with a high expectations bar).

Supply Concerns Hit Yields

Over in the bond market, intermediate Treasury yields have been rising this week, but the key driving factor there seems to be the government’s lifting of its issuance target for the third quarter, beginning with a $103 billion issue to cover refinancing of $84 billion in notes coming due on August 15. A higher than anticipated supply of new government debt has some observers skeptical that it can be accomplished without rates going up some more (though similar issuance increases in recent months have not had the effect of moving rates as much as some had anticipated).

At the same time, a jobs report on Wednesday (the ADP National Employment Survey) revealed continued strength in the jobs market. That news, when translated into bond market-speak, offers no real reason to expect interest rates will be coming down any time soon, and thus nothing to counter the upward pressure on rates from the Treasury Department’s increased issuance report.

As we are fond of saying, though, it’s always best not to read too much into one report, or even one day’s worth of financial news. Today we got a different perspective on the jobs market from the Bureau of Labor Statistics, reporting job gains of 187,000 in July against economists’ forecasts of 200,000. The BLS number fits more squarely into the macroeconomic narrative that drove investor optimism in July – slower but still positive growth in the economy, with inflation continuing to trend down (we will learn more about that second aspect next week, when the July Consumer Price Index report comes out). On the heels of the BLS report, stocks are in modestly positive territory today and bond yields are down a bit. So it goes.

We expect there will be a few more twists and turns in the coming weeks. August is often a tricky time for markets, with lower volume and more potential for outsize price swings. Then comes September, which historically is the worst calendar month of the year for stocks (always remember that “historical average” is not the same thing as “what will happen this year”). We will see what risks and opportunities lie ahead.

MV Weekly Market Flash: End of the Cycle?

It may be, or it may not be, the last time the Fed raises interest rates in the monetary tightening cycle that began in March 2022. After Wednesday’s FOMC meeting, when the Committee voted unanimously to raise rates by another 0.25 percent, we figured the likelihood of another hike at the next meeting, in September, was more or less a coin flip. Then came the second quarter GDP report on Thursday, showing that the US economy grew by 2.4 percent (annualized) from the first quarter, a much stronger showing than expected. Then came this morning’s Personal Consumption Expenditures report, the inflation reading that is less of a household name than the Consumer Price Index, but that is the Fed’s preferred measure for its policy deliberations. That report showed a month-on-month increase of just 0.17 percent for the core PCE (i.e., excluding energy and food prices).

Taking the GDP and PCE reports into account changes our calculus somewhat. We think there is a decent chance, not only that September will come and go without an additional rate hike, but that this past Wednesday may in fact turn out to be the final act of this tightening cycle. Take this with the grain of salt that any prediction deserves; there are plenty of data points due to come out between now and September 20, when the Fed next meets. But here’s what we have right now: inflation of both the headline and core varieties moving in a steady directional trend downwards, while the jobs market remains strong, consumer confidence is high, and the economy continues to grow. Modest growth alongside falling prices is the very definition of that overused air traffic control metaphor of the soft landing.

Supply and Demand

How is that even possible, though? The consensus opinion among economists, looking at comparable historical periods, is that a monetary tightening program as dramatic as this one has been (the sharpest and fastest increase in rates since the Volcker Fed in the late 1970s) was bound to create the conditions for, if nothing worse, a mild cyclical recession. That was our view earlier this year as well, and, to be sure, the probability of a recession is still greater than zero in our opinion. But there are factors at play this time around that don’t have good analogies to past tight money cycles. Some of those factors, indeed, have little or nothing to do with anything the Fed can control or influence.

Recall that, when consumer prices started to rise in a meaningful way in the middle of 2021, there were both supply and demand forces at work. Pressure on the demand side came from pent-up spending energy on the part of US consumers as pandemic shutdown conditions eased. That is what the Fed sought to influence, expecting that higher interest rates would act as a deterrent on consumer spending and help bring prices down.

But there was also supply side pressure as finely-tuned global supply chains went bonkers. Fewer goods came to market, and the obvious outcome of more money chasing fewer goods was the sharp increase in prices that reached a peak last summer. There was nothing the Fed could do about the supply side of the equation. Over time, though, those bottled-up supply chains have mostly worked themselves out. So even while consumer demand remains positive, the relative increase in goods supplied has had a cooling effect on prices.

That trend also helps explain why many of the stickiest categories in the consumer basket have been services. Prices for electric bikes, microwave ovens and the like may be lower than a year ago, but those for hotel rooms, airfare, concert tickets and restaurants remain elevated. This fact has some observers concerned that the “last mile” back down to the target level of two percent inflation will take longer than the time it has taken to get from last summer’s peak rates to today’s levels.

Those observers may well be right. On the other hand, a month-on-month gain of around 0.2 percent, such as reflected in both this week’s core PCE and the most recent core CPI report two weeks ago, implies an annual rate of inflation only slightly above that two percent target. We have two more CPI reports and one more PCE report to digest before the FOMC’s September meeting. In the absence of an unexpected spike upwards in any of those reports, why would the Fed arrive at the conclusion that it has to raise rates again – particularly while the economy otherwise continues to hum along at a modest but comfortable rate of growth? In our view, the odds that we have reached the end of the cycle are better today than they were at the beginning of July.

MV Weekly Market Flash: High Bar for Tech Earnings

There are many currents afoot in equity markets these days, and not all of them are moving in the same direction. We noted in one of our recent commentaries that the very narrow leadership of a small number of mega cap tech stocks seemed to be broadening out to other corners of the market. It’s a good time to revisit this idea, partly because earnings reports for those Big Tech names are starting to come out, and partly because it remains unclear what alternative themes (if any) might replace the “Magnificent Seven” narrative that drove the lion’s share of those double-digit gains US stock indexes have been enjoying.

Below the Headlines

Earnings season can be confusing for those who pay only cursory attention to the financial news. Take yesterday, for example. Electric vehicle behemoth Tesla reported earnings per share growth of a smidge more than twenty percent from the second quarter of 2022 to the second quarter of 2023. That number was also twelve percent higher than the consensus estimate of analysts who follow the company. Pretty good, right? Double-digit growth plus an upside surprise as the cherry on top. Someone reading the morning headlines might thus have been surprised that, at the end of the day, Tesla shares were down ten percent, one of several names dragging tech-heavy indexes like the Nasdaq sharply lower for the day.

Below the headlines is where the real action takes place, of course. The wet blanket for Tesla was a worse than expected decline in the company’s gross margin, which has come down significantly over the past year due largely to price cuts aimed at stimulating consumer demand. Over at Netflix, another one of yesterday’s big losers, the fly in the milkshake was forward guidance suggesting that average revenue per user (ARPU) was likely to continue trending down amid ongoing tumult in the streaming industry.

Valuation Scrutiny

These below-the-headlines numbers matter a great deal, particularly given where valuations currently stand after the heady first six months of the year for these tech stocks. A sky-high level of price-to-earnings, or price-to-sales or any other metric only makes sense if there is a good case to make that the denominator – the earnings or the sales or what have you – will continue to deliver. Tesla’s current forward (next twelve months) P/E ratio of 63, while fairly modest when compared the extreme-nosebleed levels of 2021, is 3.2 times the NTM P/E for the S&P 500 as a whole. The other growth engines of late – Microsoft, Apple, Nvidia and Netflix to name a few – are also considerably more richly valued than the broader market. And they all will be reporting their sales and earnings in the coming weeks.

Is the Rotation for Real?

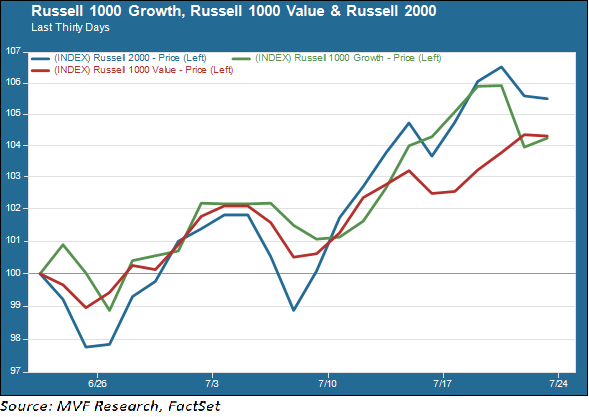
That brings us to the question of whether the recent rotation away from Big Tech to other corners of the market is for real. There is still a wide gulf between the growth leaders of 2023 thus far and the also rans. The Russell 1000 Growth index is up around 31 percent for the year to date, while the Russell 1000 Value trails far behind with a gain of just 6.5 percent or so. For the past month, though, both large cap value and small caps generally have outperformed, if only slightly, the growth engines, as shown in the chart below.

One month is not much to go on, and even a modest snapback by growth shares from yesterday’s plunge could change the positioning yet again. And there really is not a single coherent theme to define the value-plus-small caps trend, in the same way that “all things AI” has been the rallying cry for the likes of Microsoft and Nvidia this year.

However, there is a broader macroeconomic narrative that could boost some of the usual residents of value indexes like cyclical industrials and financial institutions. The much-hoped for “soft landing” for the economy as the Fed nears the end of its tightening cycle may actually be at hand. The latest numbers across a range of measures from the jobs market to inflation, consumer confidence and retails sales mostly point to a still-healthy economy. We will get the Q2 GDP numbers next week (along with what is likely to be another 0.25 percent rate hike when the FOMC meets). If we do manage to steer clear of the shoals of recession, though, that could provide more staying power to the equity rotation and offset any retreat from those very expensive tech names.

MV Weekly Market Flash: International Equities Had a Minute, Until They Didn’t

We wrap up our mid-year review of recent asset price trends with a look at non-US equities. This is a topic on which we periodically get some pushback, notably for the fact that we have been very underweight these asset classes (international developed and emerging markets equities) for quite some time now. After all, the foundational rule of modern portfolio theory as originally put forth by Harry Markowitz back in his 1952 paper on portfolio selection is diversification – distinct asset classes that do different things at different times (i.e., low correlation with other assets in the portfolio) so as to optimize risk-adjusted return over time.

A Long Way from 1952

All of that makes sense, and for that reason we did not simply waltz out of larger weights in international equities on a whim. We conducted a lot of analysis, asked ourselves the same questions over and over, and concluded that, at least for the time being, we do not see an overriding strategic benefit to these asset classes as a substantial portion of our portfolios. The world has changed since 1952 in many ways, not least of all in the closer interrelationships between the countries that make up the global economy. Markowitz’s core insights have yet to be challenged seriously by a competing theory of long-term portfolio management – but there is a case to make that the diversification benefits of non-US equities are quite a bit weaker today than they were in decades past.

The Problem With Tactics

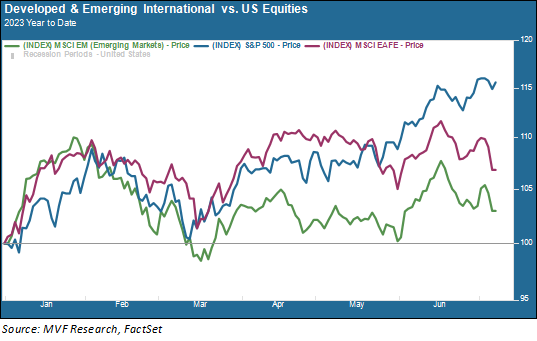
Non-US equities have certainly had periods of outperformance, including – for a very brief while – earlier this year. The chart below shows the relative performance of the S&P 500, the MSCI EAFE index of developed international equities, and the MSCI Emerging Markets index since the beginning of 2023.

For most of January, in fact, both emerging and developed international equities (the green and crimson trendlines, respectively) outperformed the S&P 500 (blue trendline). As the second quarter wound on, though, the familiar pattern of US outperformance returned. Note that in this chart we are showing returns in terms of US dollars, because what matters for a US-based client is not only how any foreign asset performs on its own terms, but how that translates back to US dollars. Much of the excitement at the beginning of the year, indeed, had to do with the US dollar losing some of its recent strength against the euro and a few key emerging markets currencies.

This highlights one of the pitfalls of making tactical (as opposed to strategic) positioning moves for non-US assets. Short-term currency movements are notoriously fickle. Even if you get it right going in, it’s next to impossible to figure out when the favorable currency position reverses is going to reverse. Currently, for example, the euro is still holding its own with a slight gain against the dollar for the year to date, but both the Japanese yen and the Chinese renminbi have fallen by high single digits against the dollar.

No Long-Term Advantage

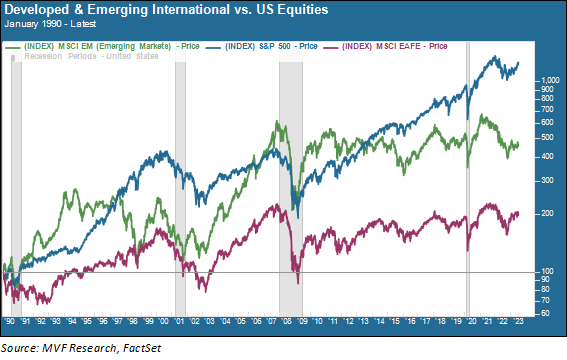
To go back to our earlier discussion about long-term portfolio construction, the strategic case for non-US equities comes up short here as well. Here below is the same chart as the one we just showed you, except that now the time period is not just a brief half-year, but a multi-cycle run of more than thirty years.

Different time period, same outcome. Since the beginning of 1990 (the start date for this chart) the S&P 500 has outperformed the MSCI Emerging Markets index by a magnitude of more than double, while that magnitude is more than five times for developed international equities as represented by EAFE.

And this doesn’t even tell the whole story. That 1952 paper on portfolio selection by Harry Markowitz that launched modern portfolio theory looks at risk-adjusted return; in other words, taking into account not just the return itself but how much volatility is associated with the return. Here things work even more against non-US equities. The average standard deviation, a basic measure of asset volatility, for the S&P 500 over the period shown about was around 14.5 percent, while for developed international it was more than 16 percent and for emerging markets around 23 percent. Less return for more risk is the opposite of what a Markowitz-efficient portfolio is supposed to achieve.

We will have more to say about this subject in a forthcoming research paper that will go into the strategic elements at a more in-depth level than here. For now, though, we will simply note that we are satisfied to have not bought into the effusive chatter at the beginning of this year about it being “the right time” to get back into international. There may be a time when it does make sense (more about that in our forthcoming research paper) – but that time, in our opinion, is not today.

MV Weekly Market Flash: Bonds in Wonderland

We continue this week with our review of 2023 at the halfway mark, today’s focus being the very strange world of fixed income. You know the mantra because you’ve heard it from us thousands of times: bonds for safety, equities for growth. We expect that will still be true in the long run, but the bond market has not been anything like an oasis of calm so far this year.

The Great Mispricing

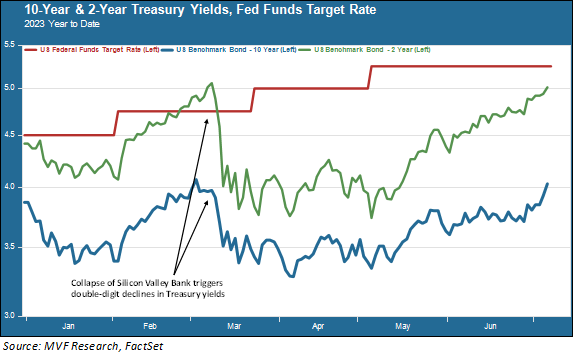
Fixed income markets had been volatile before the sudden collapse of Silicon Valley Bank in early March set off a mini-panic about the stability of the banking sector. But that event sent bond yields plummeting, with the yield on the 2-year Treasury note falling more than 20 percent in the space of three trading days.


20 percent is no small thing; imagine the frenetic news coverage that would accompany a similar magnitude of price change in the S&P 500. The financial media has something of a blind spot when it comes to chronicling yield fluctuations in the bond market. The question is why such a major reset took place in an environment where the Fed was continuing to make it very clear that nothing had changed regarding its monetary tightening program. Note in the chart above what doesn’t go crashing to earth in the wake of the banking problems: the Fed funds rate (crimson trendline).

Rate Cut Fantasies

What happened here was that the collapse of Silicon Valley Bank fed into a pre-existing narrative among fixed income investors that we never understood (and about which we have written copiously in these pages over the past few months. This narrative held that not only was the Fed just about done with raising rates, but it was on the cusp of cutting them. To repeat: this was before the banking sector troubles. When SVB collapsed, the Fed was a key part of the consortium of agencies that worked out a plan to protect depositors. Bond investors, apparently captive to the behavioral finance trap of recency bias, immediately saw the resurrection of the “Fed put” – the central bank’s tendency of recent years to rush in with a flood of liquidity every time something went pear-shaped in the market. Some in the fixed income commentariat opined that the Fed was going to scrap tightening altogether and immediately cut rates. As the above chart shows, the confusion about this didn’t go away – it persisted throughout the rest of March and April as bond yields mostly went sideways, but with a much wider up-and-down band of volatility than is normally the case for what is supposed to be the world’s safest asset.

Getting the Memo (Maybe?)

Things have settled down a bit since then, in the sense that there is some direction to interest rate trends now, rather than the directionless volatility of March and April. That direction, as the chart clearly shows, is upwards. The Fed not only did not reverse course on monetary tightening after the banking sector problems, but it continued to confront challenging data from inflation reports and the labor market, suggesting that there is more work to be done in getting consumer prices back to target levels. The June meeting of the Federal Open Market Committee, held just a couple weeks ago, showed that even while the Fed did pause for that meeting, almost all the Committee members expect not just one, but probably two more rate hikes before the end of this tightening regime. All the talk of imminent rate cuts has finally, it would seem, dissipated into the ether.

That doesn’t mean an end to the confusion, though. For a world in which core inflation is over five percent and the unemployment rate is just 3.6 percent, the inverted spread between short-term and intermediate-term bonds continues to be a puzzle. You can see in the above chart that the inversion is in fact wider today than it was a couple months ago – in fact it is wider than at any time since the draconian interest rate policy of the Volcker Fed back in the early 1980s. An inverted yield curve is supposed to be the most reliable predictor out there for an impending recession. Yet the recession – if it is indeed to come – keeps getting pushed back by the consistently strong macro data.

Two more increases in the Fed funds rate, if they in fact are to happen, will bring that overnight rate up to a range of 5.5 – 5.75 percent. In a normal world, that should imply likely further upside for other interest rates from where they are now (the 2-year is a bit over five percent and the 10-year is just over four percent as we write this). We have been approaching our duration positioning cautiously, with this dynamic in mind, and see good opportunities in the coming weeks for locking in attractive yields. But normal? This bond market is anything but normal.

MV Weekly Market Flash: A Pretty Resilient First Half for US Equities

Well, here we are already, halfway through the 2023 marathon. It’s the time of year when we go back,  re-read the opinions we shared with you in our annual outlook in January, see what we got right and wrong, and adjust our outlook based on what we know now. As Yogi Berra said, it’s hard to predict things, especially when it’s about the future. In our commentary this week we will take a close look at US equities. Next week ‘s focus will be on the bond market, and following that we will consider the case of non-US developed and international equities.

After the Fall, the Stabilization

Equity markets hit a bottom in October 2022, with the S&P 500 retreating about 25 percent from the record high set at the beginning of that year. As we surveyed the landscape at the beginning of 2023, one of the things we paid attention to was the historical pattern of stock market pullbacks in conjunction with a cyclical recession. The 25 percent drawdown in 2022 was pretty well within the range of such events in the past (we emphasize here that we are talking about traditional business cycle recessions, not events driven more by financial crises (e.g. the 2000 tech meltdown and the 2008 financial crisis) than by the attendant recessions. We opined in our annual outlook that the first half of 2023 might be volatile, but that equities should stabilize at some point and offer upside potential.

The stabilization came sooner than we might have thought; ironically, it came on the heels of an unanticipated development – the collapse of several prominent financial institutions including Silicon Valley Bank and Swiss behemoth Credit Suisse. The unrest in the banking sector could have been one of those crisis events that would test the resilience of the October ’22 lows. Instead, once it became clear that the troubles were more localized rather than a system-wide contagion, conditions settled down. As we write this article on Friday morning, the S&P 500 is up in simple price terms by more than 15 percent from its beginning of the year level, and a scant eight percent off that January 2022 high point. Meanwhile the VIX index that serves as a measure of market volatility is trading at its lowest (i.e., least volatile) level since before the Covid-19 pandemic.

AI Optimism Outlasts Recession Pessimism

The biggest complaint many investors have had about US equities in the first half of the year relates to the very narrow breadth of the rally, a topic we have covered on several occasions in our weekly commentaries. Seven mega-cap stocks did the lion’s share of heavy lifting, and the common thread tying them together was artificial intelligence. Generative AI is a core growth driver for a handful of firms including Microsoft, Nvidia, Amazon, Alphabet (Google) and Meta (Facebook). The frenzy around this theme followed the public unveiling of chatGPT, a generative AI platform that performs some fairly amazing (and sometimes bizarre) feats of responding to human queries, late last year. As we noted in our commentary of May 26 the five companies mentioned above plus Apple and Tesla, collectively accounting for around 28 percent of the S&P 500, accounted for some 85 percent of the S&P 500’s year to date gain as of that writing.

While the AI frenzy was going on, though, a not inconsiderable chorus of skeptics noted that the overall economic picture was a concern. Indeed, one of the core themes in our January outlook was the likelihood of a US recession at some point in 2023. Those who were skeptical about the AI-driven euphoria of the past several months pointed to the vulnerability of the market to a broad-based downturn once the small coterie of mega-caps had run their course. Other parts of the market like cyclicals, financials and small caps could be particularly vulnerable to a notable economic downturn.

More Room to Run?

That argument may have some reasonably compelling historical precedents. But the economy is showing quite a bit more resilience than one might have thought it would, a year and a half into the most severe monetary tightening program conducted by the Federal Reserve since the draconian shocks of the Volcker Fed in 1979-81. The jobs market has surprised to the upside month in and month out. Unemployment claims, while higher than they were a year ago, have not supplied evidence of widespread layoffs beyond a few concentrated sectors. Consumer spending, the engine of US economic growth, has stayed firm. In fact, just this week first quarter real GDP growth was revised upward largely due to better than previously estimated results for consumer spending.

We will talk more about the recession question in our piece next week on the bond market, where a persistently inverted yield curve has been screaming “recession” for many months now. For purposes of US equities, though, we do not think the potential for an imminent recession is likely to weigh heavily on stocks as we head into the third quarter. The early signs of an equity asset class rotation that we talked about in our commentary last week continue; for example, the Russell 2000 small cap index, an underperformer for most of the year so far,  has actually outperformed the tech-dominated Nasdaq for the month of June. We think there could be some more room to run, with broader participation than we have seen so far. There are always risks to consider, of course. But the equity market has done a pretty good job so far this year of climbing the fabled wall of worry.

MV Financial

Meet Our Team

Smart Strategies.

Investment Advisor Company