MV Weekly Market Flash: Earnings Exceeding Expectations
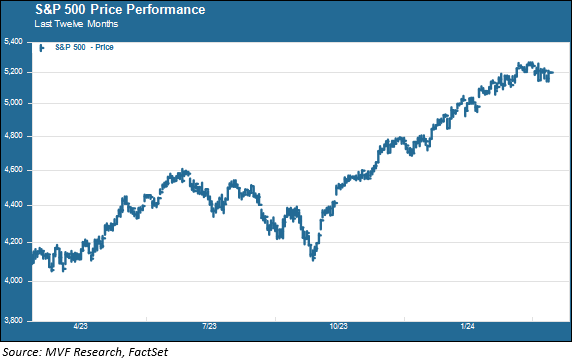
Read More From MVThe market has had another week of indecision, trying to make up its mind whether to cheer another blowout earnings quarter by Nvidia, the darling of one-day options punters, or worry itself into a corner over comments by Fed officials speculating about possible rate hikes if inflation fails to come down more. Maybe this day-to-day uncertainty explains why, according to a recent poll, half the country is convinced the US stock market is actually down for the year to date (it is in fact up more than ten percent for the year thus far and 27 percent since last October,...
Read MoreMV Weekly Market Flash: The Slowdown Is Here, and Markets Cheer
Read More From MVWhen the first quarter Gross Domestic Product (GDP) numbers came out a few weeks ago, we were among the many observers who noted that the lower-than-expected growth rate (1.6 percent real quarter-on-quarter growth, annualized) was actually not all that bad, with both consumer spending and private business investment – arguably the economy’s two most important growth drivers – sustaining their recent healthy trends. Well, that view (which among others was offered by Fed chair Jay Powell at the most recent Federal Open Market Committee meeting) may have been correct, but in hindsight it also seems like it was the opening...
Read MoreMV Weekly Market Flash: The More Things Stay The Same
Read More From MVThere is a genuinely strange phenomenon that has taken place in the global equity market over what is by now a very long time period. Consider the chart below. It shows the relative performance of five equity asset classes – US large cap growth, US large cap value, US small cap growth, non-US developed and non-US emerging markets – over four different time periods. Thirty years, ten years, five years and one year. Here is the strangeness: the performance ranking in each and every one of these time periods is nearly the same. Growth, value, small cap, international developed and...
Read MoreMV Weekly Market Flash: How the Bond Market Learned to Love the Fed
Read More From MVLove the Fed? That may be too strong a sentiment. But at the very least, the bond market is channeling its inner Dude (as in “The Big Lebowski”) and abiding the Fed. The market had already priced itself out of the multiple rate cut fantasy with which it started the year when the FOMC sat down this week to deliberate for two days on an outcome it had telegraphed well in advance. No change in rates today, no change in rates tomorrow, and we’ll just have to see what happens after that. Market pundits observing the event could come up...
Read MoreMV Weekly Market Flash: Too Early To Call Stagflation
Read More From MVWhen inflation began rising three years ago, eventually reaching levels not seen in a couple generations, the chatter among market personalities was full of oldspeak calling up the 1970s. Among the words and portmanteaux dusted off for re-use was stagflation, last observed in the wild in the days when Carter administration staffers danced under the disco ball at Studio 54. With the Consumer Price Index touching nine percent in the summer of 2022, fears of a combination of higher inflation and tepid growth mounted. Then inflation started coming down steadily and growth kept on, well, growing, and talk of stagflation...
Read MoreMV Weekly Market Flash: Dollar Dominance and the Ghosts of 1997
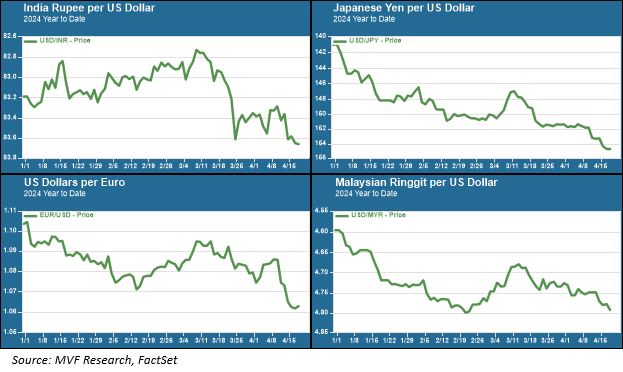
Read More From MVOne of the big stories in markets this year has been the hale performance of Japanese equities, with the benchmark Nikkei 225 index finally clawing back to and surpassing the record high it had set 34 years earlier, at the end of calendar year 1989. Currently the Nikkei is up 13.2 percent for the year – not bad! But that’s 13.2 percent in local currency terms. Unfortunately for investors whose portfolios are calculated in US dollars, the Japanese yen is down around ten percent versus the greenback. So that nice gain on Japanese stocks winds up as a fairly anemic...
Read MoreMV Weekly Market Flash: Sideways, With a Splash of Uncertainty
Read More From MVWith all due respect to T.S. Eliot, April is not necessarily the cruelest month – but so far it has not been particularly upbeat either, as far as US equities are concerned. The S&P 500 established its last record high on the last Thursday in March, right before the long Easter weekend. Since then, stocks have bounced around – with a bit more volatility than we’ve been used to seeing lately – in a mostly directionless manner. As usual, there are quite a opinions out there as to what it all means – is this a pause before a long...
Read MoreMV Weekly Market Flash: Oil, Jobs and Money
Read More From MVLet’s just say that it has not been a great time in recent weeks for the Six Cut Crowd. You remember these folks, the ones who took the Fed’s three rate cut scenario at last December’s FOMC meeting and promptly doubled that scenario. Not three, no, no, no, but six rate cuts in 2024! That seemingly (to us, anyway) outlandish view fully priced itself into the bond market and pushed yields down as the year came to an end. The 10-year Treasury yield, which had briefly touched five percent in October, ended the year around 3.8 percent. Equity investors got...
Read MoreMV Weekly Market Flash: China’s Long Game
Read More From MVA few weeks ago we used this space to write about China and India, the two largest countries in the world by population that both figure prominently into the global economy. If you recall from our commentary that week, India’s stock market has been going gangbusters while China’s has brought nothing but disappointment to those looking for a portfolio win from there. Not surprisingly, therefore, there has been a good deal of chatter among market pundits recently encouraging investors to get on board the India train. It’s easy to tout the benefits of a trade when that trade is enjoying...
Read MoreMV Weekly Market Flash: The Happiest Fed Ever
Read More From MVNo, Jay Powell did not do a happy dance at the post-FOMC press conference, but the Fed chair was feeling good on Wednesday and it showed. And why not? The big takeaway from the much-anticipated “dot plot” – the Summary Economic Projections representing Committee members’ best guesses about the economy and interest rates – was the upward revision in growth expectations. After growing 3.2 percent in the fourth quarter last year (and 3.1 percent for 2023 overall), the median FOMC projection for 2024 real GDP growth is 2.1 percent, up substantially from the 1.4 percent median estimate in the last...
Read More