Meet Our Team
MV Weekly Market Flash: Uneasy Calm as Banks Report Earnings
MV Weekly Market Flash: How Confident Are Consumers, Really?
MV Weekly Market Flash: Two Cheers for the Rally, and a Caveat
MV Weekly Market Flash: Some Signals Amid the Noise
MV Weekly Market Flash: Bad Banks and Bad Bankers
MV Weekly Market Flash: What Today’s Jobs Numbers Tell Us
MV Weekly Market Flash: The Least Discussed, Most Important Metric
MV Weekly Market Flash: PCE Seals the Memo
MV Weekly Market Flash: No Landing, Or Delayed Landing?
MV Weekly Market Flash: Making Sense of the Split Message

MV Weekly Market Flash: Uneasy Calm as Banks Report Earnings

Read More From MV

More than one month has passed since the Silicon Valley Bank failure gave investors something new to worry about. The health of the banking sector at large was in question, and the worries compounded as more problematic institutions trickled into the news: Signature Bank of New York, First Republic Bank, Credit Suisse. The good news is that conditions have stabilized since that first spate of failures. Deposit outflows have slowed, and banks have reduced their emergency borrowing activity at the Fed’s discount window and the Bank Term Funding Program that was set up to provide liquidity in the wake of...

Read More

MV Weekly Market Flash: How Confident Are Consumers, Really?

Read More From MV

Consumer spending drives the US economy, as the single largest factor influencing gross domestic product. The resilience of the consumer has been the story of the past twelve months, with a demonstrated willingness to accept the higher prices consumer-facing companies have been passing on to offset their own higher input costs for labor and materials. In earnings management calls over the last year, company after company has offered up some version of the following formula: average ticket higher, average transaction count lower. That meant, in essence, that even if demand was weakening, the decline in footfall was compensated by higher...

Read More

MV Weekly Market Flash: Two Cheers for the Rally, and a Caveat

Read More From MV

Today is the last day of the first quarter of 2023 (where, oh where, does the time go?). If there’s a simple way to sum it up from a stock market perspective then here it is: tech good, banks bad. There in one single picture is the fallout from the banking sector troubles that began in the first week of this month with the collapse of Silicon Valley Bank and a couple crypto-centric banks, then led to the strange (and highly questionable from a capital structure standpoint) drama of Credit Suisse’s swan song as an independent organization. Bank shares plunged...

Read More

MV Weekly Market Flash: Some Signals Amid the Noise

Read More From MV

This has been a strange week. It started – as now seems to be the norm – on Sunday with a trio of Swiss financial authorities announcing the takeover of Credit Suisse by UBS. That arrangement looked less like a polished deal brokered by well-tailored financial elites, and more like a backcountry shotgun wedding. Then came Wednesday, which was supposed to be Fed day until Janet Yellen stole the spotlight with her comments to a Senate appropriations committee about the banking system. Bond yields, share prices and all manner of other assets have been all over the place. It’s been...

Read More

MV Weekly Market Flash: Bad Banks and Bad Bankers

Read More From MV

Just one week ago, we were sitting here writing about the latest jobs and inflation numbers, figuring that those were the only open items left for the Fed to consider ahead of its March 22 meeting on monetary policy. How quaint that seems now, in hindsight. Around the same time, in the middle of the day last Friday, the news broke that the sixteenth-largest bank in the country, Silicon Valley Bank, was being taken over by federal regulators in the wake of a massive run on the bank by angst-ridden depositors. Fast forward to today, and there has been a...

Read More

MV Weekly Market Flash: What Today’s Jobs Numbers Tell Us

Read More From MV

In his semiannual testimony to Congress on monetary policy this week, Fed Chair Jay Powell noted that there were two more key pieces of data the Fed would take into consideration before deciding what move to make on interest rates at the next Federal Open Market Committee meeting, which will conclude on March 22. Those data points were the February jobs numbers, which came out today, and the Consumer Price Index (also for February) which will post next Tuesday. Hot…Or Not? We have one of those data points in hand now. Nonfarm payrolls, the most-watched figure in the jobs report,...

Read More

MV Weekly Market Flash: The Least Discussed, Most Important Metric

Read More From MV

Major macroeconomic indicators come with their own special days of the week. We have “Jobs Friday” for the monthly labor market report put out by the Bureau of Labor Statistics (BLS), and “Inflation Tuesday” when that same institution publishes the Consumer Price Index for the prior month. Those two reports in particular generate lots of furrowed-brow chatter among financial media talking heads when they come out, and rightfully so. There is another day of the week, though, that tends to come and go without creating much fanfare. Productivity Thursday was yesterday – did anyone notice? Our good friends at the...

Read More

MV Weekly Market Flash: PCE Seals the Memo

Read More From MV

We have talked quite a bit in recent commentaries about the market’s odd habit of fighting the Fed throughout the monetary tightening period that began nearly one year ago. ps-metalsheet.com Even the jualbelilaptopbandung.com estimate.fsroofs.comEconomist magazine, one of the more sober and dispassionate corners of the financial media landscape, chimed in recently with the observation that “sometimes it’s okay to fight the Fed.” Hmm, maybe not so much. On the heels of a heady January when it sometimes seemed like we were headed right back to the bubble-blowing meme stock craze of 2021, the big news in markets over the past...

Read More

MV Weekly Market Flash: No Landing, Or Delayed Landing?

Read More From MV

One of the phrases making the rounds among the financial media chatterboxes this week has been “no landing.” This is the too-cute-by-half riposte to the usual dual-choice framework of “hard landing” or “soft landing” when issuing an opinion on where the economy finds itself as the Fed finishes off its monetary tightening cycle. Last week’s barnstorming jobs report gave some octane to the no-landing narrative. So did this week’s retail sales print, showing that consumers spent at a rate roughly double that of economists’ forecasts in January. Over in Europe, the freakishly balmy weather this winter has served up seems...

Read More

MV Weekly Market Flash: Making Sense of the Split Message

Read More From MV

Like many of our peers in the industry, we have spent much of the past few months looking at the bond market from every angle, shaking it, turning it upside down and trying to figure out what message it is sending. At face value there doesn’t seem to be a single, consistent message here. Credit risk spreads – i.e. the additional compensation investors are supposed to demand for holding riskier assets than super-safe government bonds – remain tight. The current spread between Baa investment grade corporates and the 10-year Treasury yield is 1.8 percent, as compared to the three-year average...

Read More
MV Weekly Market Flash: Uneasy Calm as Banks Report Earnings

More than one month has passed since the Silicon Valley Bank failure gave investors something new to worry about. The health of the banking sector at large was in question, and the worries compounded as more problematic institutions trickled into the news: Signature Bank of New York, First Republic Bank, Credit Suisse. The good news is that conditions have stabilized since that first spate of failures. Deposit outflows have slowed, and banks have reduced their emergency borrowing activity at the Fed’s discount window and the Bank Term Funding Program that was set up to provide liquidity in the wake of the Silicon Valley Bank nosedive. But there is an element of unease to the calm, with a sense that more trouble lies ahead. Not so much of the systemic bank failure variety of trouble, but more about what the likelihood of sharply reduced credit creation means for the general economy.

The Big Get Bigger

One of the first things many people did after SVB hit the news was to pull their money out of their local mom-and-pop banks and put it into one of the banking giants. Today we got some hard data about this trend as the largest banks kicked off the first quarter earnings season with their results. JPMorgan Chase recorded deposit growth of $37 billion in the first quarter, with much of that coming in the last three weeks of March. The institution’s net interest income (the difference between what they earn from loans & other assets and what they pay on deposits) grew 49 percent year-on-year, and net earnings per share of $4.10 far exceeded the $3.39 EPS expected by analysts covering the company. Other leading banking institutions including Citi, Wells Fargo and PNC also exceeded analysts’ earnings estimates. This is an important bit of good news, since these are the institutions that would be at the core of a genuine systemic failure. Their strength is a sign of health for the system at large.

Storm Clouds

JPMorgan Chase head Jamie Dimon is fond of the phrase “storm clouds,” which he often invokes in the same paragraph as “healthy footing” in talking about the economy. As in: healthy footing today but storm clouds on the horizon. Those clouds may be nearer and darker than they were the last time Dimon used the phrase, three months ago. In today’s earnings report the bank noted a reserve build of $1.1 billion to provision for potential credit losses. The recent turmoil in the banking sector will likely result in tighter credit conditions as banks curtail lending and focus on maintaining adequate liquidity and capital reserves. Less access to credit is in turn likely to accelerate the slowdown in consumer activity that we saw evidence of even before the SVB failure. And as we know – all together now – consumer spending drives the US economy, so when it slows so does everything else.

In summation, our main takeaway from what we have seen so far of bank earnings underscores the fundamental difference between the current environment and the 2008 crisis – this is not a systemic event that threatens the system’s core infrastructure. We expect conditions will continue to stabilize. But the slowdown in credit will likely be an accelerant to already-slowing consumer activity. Interest rates are not likely to come down any time soon (no matter what the bond market thinks), which will further deter credit creation. The growth cycle will resume, but likely not before we have a few slow months.

MV Weekly Market Flash: How Confident Are Consumers, Really?

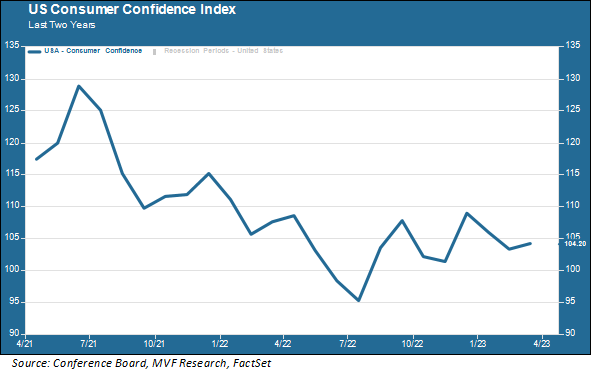
Consumer spending drives the US economy, as the single largest factor influencing gross domestic product. The resilience of the consumer has been the story of the past twelve months, with a demonstrated willingness to accept the higher prices consumer-facing companies have been passing on to offset their own higher input costs for labor and materials. In earnings management calls over the last year, company after company has offered up some version of the following formula: average ticket higher, average transaction count lower. That meant, in essence, that even if demand was weakening, the decline in footfall was compensated by higher prices. Sales continued to grow, and profit margins remained healthy, thanks to consumers’ willingness to put up with the price increases. The Conference Board Consumer Confidence Index, a measure of household sentiment about their current and forward-looking financial situation, has held up reasonably well although understandably lower than the stimulus-aided optimism evident in early 2021.

As the Ticket Turns

That consumer confidence readout of 104.2 in March was actually a bit higher than analysts had expected. A reading above 100 tends to be seen as expansionary, so that would seem to be good news. But we are starting to get data coming in from other sources suggesting that actual retail activity is reflecting a change in consumer behavior; in particular, a slowdown in discretionary spending with less willingness to passively accept monthly price increases. In a report that came out yesterday on March sales activity Costco, a bellwether for middle class consumer spending trends, average ticket was down by about 2.7 percent from the previous month – a reversal of recent trends and below expectations. The company also noted a distinct move away from big-ticket discretionary items to lower-margin consumer staples. That fits with a trend we have been seeing elsewhere, and we expect see more of it as the Q2 earnings season gets underway in full starting next week.

JOLTS to the market

A key element of consumer confidence, of course, is the strength of the jobs market. Simply put, the more confident you are about your current job and take-home pay, the more sanguine you are likely to be about your monthly spending plans. As we have noted repeatedly over many months, the US labor market has been strong to a degree that has puzzled many economists, including those at the Fed. Even while noting the many upside surprises, like the blowout 504,000 nonfarm payroll gains in the January report this year, we have also reminded our readers that jobs numbers tend to be a lagging indicator, following rather than leading directional changes in the economy.

This week the market seemed to get caught flat-footed by a data point showing about 500,000 fewer job vacancies in February than economists had been predicting. The JOLTS (Job Openings and Labor Turnover Survey) report by the Bureau of Labor Statistics seemed to suggest that the labor market’s ability to defy gravity after a year of Fed rate hikes might be coming to an end. Or not, one could argue, because it’s just one number. But the next day another labor market report – the ADP Employment Survey – also came in well below expectations. And today we saw a higher than expected number of initial claims for unemployment insurance. So now it’s not just one number but three, in the space of three days.

Bonds Bet on Burns

What does all this mean for the market? The short term, as we always say, is unknowable. That said, we continue to shake our heads in wonder at the bond market’s seemingly unshakeable conviction that Fed rate cuts are just around the corner. Yields on 10-year Treasuries are now below 3.3 percent, and the entire yield curve remains below the upper boundary of the Fed funds target rate – with at least one more Fed funds rate increase likely when the Fed next meets in early May. The bond market seems to be betting on Jay Powell channeling his inner Arthur Burns – the Fed chair during the tumultuous middle years of the 1970s whose constant zigging and zagging back and forth between fighting inflation and staving off recession accomplished neither and cost the Fed dearly in credibility. But Powell is not Arthur Burns and we continue to believe that the market’s pricing in of rate cuts in the second half of this year is a fool’s errand. We may be wrong. And it will be increasingly hard for the Fed to navigate its monetary policy if the signs of a consumer-led downturn continue to build up – particularly now with the attendant concerns about a credit crunch in the banking sector. But we don’t think those rate cuts are coming until inflation is on a clear and directionally robust path downward. That, as we see it, is yet to happen.

MV Weekly Market Flash: Two Cheers for the Rally, and a Caveat

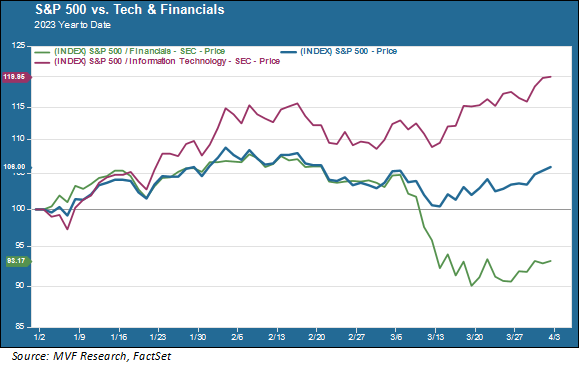
Today is the last day of the first quarter of 2023 (where, oh where, does the time go?). If there’s a simple way to sum it up from a stock market perspective then here it is: tech good, banks bad.

There in one single picture is the fallout from the banking sector troubles that began in the first week of this month with the collapse of Silicon Valley Bank and a couple crypto-centric banks, then led to the strange (and highly questionable from a capital structure standpoint) drama of Credit Suisse’s swan song as an independent organization. Bank shares plunged in the wake of the SVB meltdown, for understandable reasons, while Big Tech was off to the races, for reasons we will explore in further detail below.

Happily for investors, the math for this arrangement works in our favor. The financial sector accounts for about 12.5 percent of the total market capitalization of the S&P 500. The tech sector makes up 25.8 percent of the index; however, when you add in a few names from other sectors that tend to move as tech does – Alphabet (Google), Meta (Facebook), Netflix, Amazon and Tesla – the combined market cap rises to 36 percent of the total S&P 500. In other words, the gains enjoyed by tech more than compensated for the hit taken by the banks.

The Tech Formula for Growth

But why, you might ask, do tech firms benefit from trouble in the banking sector? There are a couple reasons. The first – and we would argue the single biggest catalyst behind the upside in tech shares over the past few weeks – is interest rates. The intervention by the Fed, Treasury Department and FDIC to backstop the uninsured deposits of Silicon Valley Bank had the immediate effect of changing market perceptions on the Fed’s inflation-fighting monetary policy. Treasury yields came down across the board, with the Fed-sensitive 2-year yield plunging from a pre-SVB high of 5.06 percent to a low of 3.77 percent before rebounding a bit. Think about it – that represents a change of more than 25 percent from the high to the low, in just a matter of days. Indeed, the bond market has been more volatile than the stock market over much of the past three weeks.

Stock price valuations are heavily influenced by interest rates, and a reduction in rates will, simply as a matter of discounted cash flow math, raise share values. Companies with a higher proportion of growth taking place farther out in future time periods react even more to interest rate changes (again, math). In that sense it was sort of like 2020 all over again.

In another sense, though, the rally in Q1 2023 has been quite a bit more selective than the anything-goes mania of that earlier bull run. This rally has been highly concentrated in the largest of the large cap tech names, which gets us to the second reason for how the banking sector has helped tech stocks. Market observers looking ahead anticipate, correctly we believe, that credit conditions are due to tighten as banks become more selective in their lending standards and focus on shoring up their capital and liquidity reserves. These conditions will be tolerable for the mega-cap companies with relatively low (or negative) net debt to equity ratios and loads of cash on their balance sheets. The conditions will be tougher for smaller, unproven, profitless names with a shrinking number of options for obtaining external financing.

Now for the Caveat

In our title for this piece we said “two cheers” as opposed to the more customary formula “three cheers,” and that is because in place of the third cheer we see a caveat, a buyer-beware element to the rally. The dramatic decline in interest rates is for the most part premised on something we consider highly unlikely; namely, that the Fed will start a series of interest rate cuts as early as this summer. In other words – yet another instance of the market fighting the Fed. Powell once again reiterated at the FOMC press conference on March 22 that the Committee’s base case plans for 2023 involve no rate cuts. Zero. The fight against inflation continues.

That’s not set in stone, of course. But consider that even if the Fed makes just one additional 0.25 percent increase to the Fed funds rate and holds it there for the rest of the year, that still means that the rest of the yield curve will be tethered to a Fed funds rate range of 5 to 5.25 percent. Currently only the 6-month Treasury yield, at 4.9 percent, is even within striking distance of that highly probable future Fed funds rate. The 2-year yield is still down around 4.1 percent If bond yields reprice upwards, which we think is likely, then stock valuations will follow suit (again, math). It’s been a good ride to finish out the year’s first quarter. But there will be plenty to deal with in the three to come.

MV Weekly Market Flash: Some Signals Amid the Noise

This has been a strange week. It started – as now seems to be the norm – on Sunday with a trio of Swiss financial authorities announcing the takeover of Credit Suisse by UBS. That arrangement looked less like a polished deal brokered by well-tailored financial elites, and more like a backcountry shotgun wedding. Then came Wednesday, which was supposed to be Fed day until Janet Yellen stole the spotlight with her comments to a Senate appropriations committee about the banking system. Bond yields, share prices and all manner of other assets have been all over the place. It’s been a cacophony of noise, but there are at least a few signals that seem to be coming through.

Organic Monetary Policy

Let’s start with the Fed, because Jay Powell was probably the most clear-spoken individual this week in communicating what we can expect to see from his organization in the weeks ahead. If your bingo card had “the banking system is sound” on it going into the Wednesday afternoon press conference then you were not disappointed – that was literally the first phrase out of Powell’s mouth as the event began. As expected, the FOMC voted to raise the target Fed funds rate by 0.25 percent to a range of 4.75 to 5.0 percent. Also, in what should not have been a surprise, Powell stated that the central bank has no intention in its base case scenario of cutting rates any time in 2023. We remain utterly baffled by the determination of both the stock market and the bond market to live in a pretend world where the Fed takes us right back to the zero interest rate world of the 2010s, no matter how many times Powell and his colleagues tell them otherwise.

The key takeaway – and the clearest signal for how the Fed sees the next few months unfolding, is that the recent unrest in the banking system is likely to result in a naturally tightening financial environment. In other words, banks are going to curtail their lending activity and focus on strengthening their liquidity and capital reserves. This – which we call “organic monetary policy” – will take some of the burden off the Fed in needing to raise rates much further. What we heard from Powell was that one more rate hike of 0.25 percent is probably all the Fed needs to do. The more cautious pace of activity in the banking sector will do the rest in helping bring inflation back down.

Janet Yellen’s Star Turn

Normally, Fed week is all about the FOMC press release, the “dot plots” showing where committee members expect interest rates to be, and of course the press conference where reporters try to trap Powell into a “gotcha” moment that will give them a prominent byline and maybe move markets. But this week it was Treasury Secretary Janet Yellen who created more midweek buzz as she told a Senate appropriations committee that the administration was not intending to go it alone in regard to taking off caps on deposit insurance. In other words, the government was not giving blanket coverage to the full quantity of $19.2 trillion worth of deposits in the US banking system. Yellen’s remarks seemed to be the main catalyst for the late selloff in stocks on Wednesday afternoon.

But did she really mean it? Yellen would take to the microphone three more times in the course of the week to clarify, or re-clarify, or re-direct, what she meant such that at this point nobody really knows what the official policy is regarding potential further weakness in the sector. It seems for now that situations will be dealt with on a case-by-case basis. That will probably be fine if conditions stabilize – which at least for now seems to be the case. Our main concern, though, is that the absence of a clear policy will result in more nervous depositors pulling their money out of small and midsize banks, which if it happens will turn a small problem into a big problem. There is some talk in Washington about potential room for agreement among legislators to come up with a bipartisan policy for deposit insurance. We are a bit skeptical of any conversation that includes the word “bipartisan” but hope there is some substance to those rumors. We need clarity around a policy, not just case-by-case decisions on whether to intervene or not, and if so how.

About That Swiss Bank

With everything else going on in the financial world this week you would be excused for not paying too much attention to a thing called “Alternative Tier 1 Bonds,” or AT1s. But this may be the single piece of that warped UBS takeover of Credit Suisse that casts a longer-term shadow over securities markets.

Credit Suisse had about $17 billion worth of these bonds, which are considered to be a hybrid type of debt instrument for the purposes of giving banks greater flexibility to manage their capital in the event of crisis situations. The bonds tend to pay out a relatively high rate of interest due to their riskiness, which riskiness is clearly stated in contractual language that the value of said bonds can be wiped out completely in the case of “extraordinary events.” And wiped out they were. Every investor holding Credit Suisse AT1 bonds got zero point zero on every dollar of exposure.

Here’s what makes the situation strange, and explains why the jilted AT1 bondholders are in the process of suing the Swiss financial authorities who gave them the axe. There is a thing in finance called the capital structure, which is essentially a ladder of risk from the riskiest to the most secure types of capital. The bottom rung of that ladder is common equity – the riskiest – and from there it goes up through preferred stock, junior (subordinated) bonds all the way up to senior secured debt. That’s the capital structure as everybody learns in Finance 101 and is the assumed impermeable order of things when evaluating the potential risk and return of alternative financial instruments.

In the Credit Suisse case, though, the capital structure was turned on its head by the financial regulators who authored the deal. Holders of common stock in Credit Suisse got paid $3.25 billion collectively by UBS as it acquired the bank, while the AT1 bondholders, as noted above, lost everything. Yes – legally, according to the bonds’ covenant language, the bondholders should have known they stood the chance of losing everything. But a bondholder could make a valid argument (whether or not a legally actionable argument) that in any such “extraordinary event” it would go without saying that the common shareholders would be the first ones kicked out the door. We’ll see how this plays out in court (probably not to the benefit of the bondholders, we would imagine). But the idea of financial regulators summarily deciding that the politics of a deal justify overriding the normal rules of capital structure – that’s not a good look (especially given that the profiles of some of the shareholders involved are, to be blunt, political). It may be around to haunt markets for some time to come.

MV Weekly Market Flash: Bad Banks and Bad Bankers

Just one week ago, we were sitting here writing about the latest jobs and inflation numbers, figuring that those were the only open items left for the Fed to consider ahead of its March 22 meeting on monetary policy. How quaint that seems now, in hindsight. Around the same time, in the middle of the day last Friday, the news broke that the sixteenth-largest bank in the country, Silicon Valley Bank, was being taken over by federal regulators in the wake of a massive run on the bank by angst-ridden depositors.

Fast forward to today, and there has been a veritable fire hose of events and moving pieces that has complicated the picture of economic health, the soundness of the global banking system and, yes, what the Fed should do when the Federal Open Market Committee meets next week. Let’s try to pin down some of the many crisscrossing stories and see if we can find a common thread.

Burning Down the House

We’ll start with the story that launched all the subsequent craziness. The first thing we should emphasize is that the Silicon Valley Bank saga is not, as far as any of the evidence to date suggests, the tip of an iceberg of systemic risk throughout the banking system. A bank that catered almost exclusively to the Silicon Valley ecosystem of tech start-ups, venture capitalists and their ilk had grown fat on deposits from the industry’s mountains of cash generated during the latest boom cycle that peaked in 2021.

Not knowing what else to do with all the deposit money pouring in from their customers, the bank invested billions of dollars into US Treasury and mortgage-backed securities – a seemingly safe move except that it happened at the peak of the market when interest rates were near zero. When the Fed began its interest rate increases last year the value of those securities fell accordingly. For reasons that seem unfathomable to us, SVB’s executives sat by and did nothing while the Fed kept raising rates and their assets kept falling in value. At the same time – and largely for the same reason of rising rates – the fortunes of their customers in tech land were fading fast. As these customers made withdrawals to fund their companies’ operations, the pace of new money coming in slowed to a trickle, putting the bank’s liquidity coverage into question.

Even with the increasing shakiness of SVB’s financial soundness, though, the bank could have arguably muddled through had it not been for the ability of a few prominent Silicon Valley influencers – mostly the venture capitalists whose portfolio of start-ups were the lifeblood of SVB’s customer base – to incite the financial equivalent of a panicked mob rush to the exits of a burning building. In just one day, a week ago Thursday, $42 billion worth of deposits bum-rushed out the door. Enter the regulators, and goodbye to the beating heart of Silicon Valley’s financial microsystem.

End of the Road for Crypto Banks

We tell the story of Silicon Valley Bank in order to emphasize the unique combination of factors responsible for its demise. This fact is in stark contrast to the root causes of the 2008 financial crisis. Then, the problem was systemic because almost all the major players were exposed, to one degree or another, to the same toxic assets (and highly leveraged to boot). SVB’s business model, asset mix and customer base profile were in no way widely replicated throughout the system.

Unfortunately, though, the timing of SVB’s demise coincided with other problems revealing themselves in the banking system. One day before all those tech bros stampeded out of SVB a bank with a similar-sounding name but a very different business model had folded. This was Silvergate, a bank that styled itself as a gateway between the starched-shirt world of traditional banking and the Wild West of cryptocurrencies. Whatever that means in actuality, Silvergate wound down its operations on March 8. A few days later another crypto-centric bank, Signature Bank of New York, was revealed to have failed and was taken over by federal regulators.

Last Sunday afternoon – a few hours before financial markets in Asia were due to open – a team of US government representatives from the Treasury Department, the Fed and the FDIC announced that all depositors in Silicon Valley Bank and Signature Bank – not just those with deposits of $250,000 or less but all depositors – would be made whole. Now things were getting strange, and unsettling. If these two banks, each with its own particular story of misery and without evidence of some kind of systemic linkage, were being treated the same way by the regulators, what else might be out there that could go wrong?

Another Country Heard From

While investors tried to digest what all this meant for the US banking system, yet another tale of woe hit the tape. This one came, of all places, from the august banking capital of Zurich, Switzerland. Credit Suisse, which along with its peer rival UBS has sat atop the world of bespoke finance for the wealthiest of the ultra-wealthy for many decades, had been on a slow burn for many months. Myriad problems including lax risk and compliance controls, shoddy financial reporting and a major data breach had been public knowledge since at least last fall. But this week Credit Suisse shot back into the headlines when its biggest investor, the Saudi National Bank, announced that it would not be providing any further assistance to the bank beyond the 9.8 percent equity stake it already had.

Credit Suisse is plugged into the global financial system in a way that neither Silicon Valley Bank nor the crypto twins of Silvergate and Signature Bank ever were. Was this, then, the signal that the problem was, in fact, systemic? No. But there was already a bad enough vibe coursing through the financial bloodstream that the Swiss central bank deemed it appropriate to step in with a $54 billion liquidity facility to shore up confidence among investors and depositors. The bank remains solvent, but its future is cloudy.

What Are The Common Threads?

There are still more banking stories out there. A consortium of major US banks put together a rescue plan yesterday for First Republic Bank, a west coast institution with a large base of high net worth investors that had come under fire in the wake of the SVB failure. Other smaller regional banks have seen a wave of deposit outflows as customers head for the perceived safety of the largest institutions, or avoid banks entirely and plonk their cash in money market funds. And banks’ use of the Fed’s discount window, which tends to be used as a last-resort liquidity backstop, surged to a record high of $152 billion this week.

Do we still maintain that this is not a systemic problem? Yes. But that does not mean that there are no common threads connecting these stories. We see two linkages that stand out.

The first common thread is bankers behaving badly. As we described earlier, Silicon Valley Bank’s executive team seemed to go through the entirety of 2022 with blinders on, willfully ignoring the direction of interest rates even while, FOMC meeting after FOMC meeting, Jay Powell kept saying the same thing about “higher for longer.” SVB ran itself more like a risk-hungry investment bank than a staid, prudent manager of other people’s money. As for the crypto banks – well, if your business model is based on an asset that still cannot plausibly demonstrate that it has a credible use case outside of black market business on the Internet, then that sort of speaks for itself. And poor management at Credit Suisse, as we noted above, has been evident now for a very long time.

Tolstoy wrote in “Anna Karenina” that every unhappy family is unhappy for its own particular reasons. The same can be said about banks in the current environment: every tale of misery has its own unique story of how things turned south.

That might not be so bad except for the other common thread between these stories: trigger-finger depositors. Are there deep-seated problems at all the regional banks where customers have been pulling out their money this week? Most likely not. But finance, as we all know, is based on confidence. And human emotions, as we also know very well, are highly vulnerable to the lizard brain instincts of fear and greed. One bank’s bad management can become a system-wide problem if confidence is not restored.

That’s why we have both government regulators and private consortia (like the team of banks that put together the rescue package for First Republic). The measures taken so far are, we believe, appropriate for the situation at hand. These measures suggest to us that both the regulators and the other systemically critical banks – the likes of JPMorgan Chase and BankAmerica – see the situation similar to how we see the situation; i.e. a few stories of poor management by bad bankers and a need for a liquidity backstop to calm the frayed limbic brains of angst-y depositors.

The other part of the story, of course, is what all this means for the broader economy and for the Fed’s decision on interest rates next week. We could spend a whole other commentary just on this – and it is very likely we will do just that next Friday, in the wake of the FOMC meeting next Wednesday. For now, though, we will note that the European Central Bank went ahead this week with the 0.5 percent increase in rates that had been expected before all the banking news broke. That, to us, was the right thing to do. As the ECB noted in its post-meeting communique, inflation is still “too high” and the fight to bring it down needs to continue. The central bank’s decision should also be good for the message it sends about confidence that the banking system can continue to function soundly even as central banks continue to fight inflation. We expect to hear similar sentiments from Jay Powell next week.

MV Weekly Market Flash: What Today’s Jobs Numbers Tell Us

In his semiannual testimony to Congress on monetary policy this week, Fed Chair Jay Powell noted that there were two more key pieces of data the Fed would take into consideration before deciding what move to make on interest rates at the next Federal Open Market Committee meeting, which will conclude on March 22. Those data points were the February jobs numbers, which came out today, and the Consumer Price Index (also for February) which will post next Tuesday.

Hot…Or Not?

We have one of those data points in hand now. Nonfarm payrolls, the most-watched figure in the jobs report, grew by 311,000 last month. That was significantly more than the 215,000 increase economists expected. So…hot, right? And thus bad for the market, because the Fed will have to turn up the heat even more, right? Not necessarily. Let’s consider that number in the context of its two-year trend.

To be sure, 311,000 is still a hefty gain. Lots of jobs were created last month in leisure and hospitality, retail and health care. Notable job losses occurred in technology, which is unsurprising given all the stories we’ve been reading over the past few weeks about layoffs at major tech and communications companies. But you can also see from the chart that in the context of the two-year trend, 311,000 jobs is well below the average, which for the period shown in the chart is 491,000. Even in comparison with the past six months – i.e. excluding some of those earlier blockbuster months when payroll gains topped 700,000 – the February numbers are pretty modest.

So maybe not so hot?

Lagging, Not Leading

Moreover the other headline number from the BLS report – the unemployment rate – also ticked up. Granted, 3.6 percent is still a very low unemployment rate and it rose from the 54-year low of 3.4 percent last month, but it still represents at least some evidence that recent labor market strength may be cooling off. And here is a key point with regard to the jobs report: it is a lagging indicator. Employers don’t typically lay people off by anticipating an economic slowdown way ahead of one actually happening. They see sales slowing down for a few months and then decide it’s time to start cutting costs. You expect to see the jobs numbers start to turn much closer to an actual downturn, not many months ahead of it.

Two other figures in today’s report seem to support the idea that conditions are starting to soften. Average wages grew by eight cents, or 0.2 percent from January to February, translating to a year-on-year increase of 4.6 percent. That was lower than the 0.4 percent month-on-month increase predicted by economists, and thus a sign that despite the continued plentitude of job vacancies, wage pressure is not building up much. That has important implications for the Fed. If wages are held in check it suggests that we are not on the cusp of the kind of wage-price spiral that got out of control in the 1970s, the last time we had inflation running at high levels.

And buried in the BLS report was another interesting figure: the number of persons jobless less than five weeks grew by 343,000 to 2.3 million. That’s a big number and notable change from January, and it is also a contrast to the relatively unchanged state of affairs for those unemployed for longer periods of time. In other words, it would seem, the layoffs we’ve been reading about in recent weeks are starting to show up in the job loss tables. It will be interesting to follow this statistic in the coming months.

Back to You, FOMC

Of course, we do not know how today’s numbers will factor into the FOMC’s equation for its March 22 decision on rates (though we did see the market’s consensus probability of a 0.5 percent rate hike fall from 60 percent before the BLS report to 43 percent afterwards – take that real-time hot take for whatever it’s worth, or not). And we still have to see what happens on Inflation Tuesday next week. But we think the jobs numbers – we repeat, a lagging indicator – are starting to show evidence that the Fed’s monetary tightening is having an effect. We’ll soon see what Powell & Co. have to say about it.

MV Weekly Market Flash: The Least Discussed, Most Important Metric

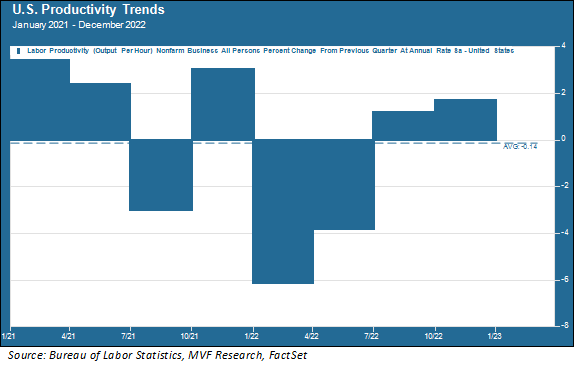
Major macroeconomic indicators come with their own special days of the week. We have “Jobs Friday” for the monthly labor market report put out by the Bureau of Labor Statistics (BLS), and “Inflation Tuesday” when that same institution publishes the Consumer Price Index for the prior month. Those two reports in particular generate lots of furrowed-brow chatter among financial media talking heads when they come out, and rightfully so. There is another day of the week, though, that tends to come and go without creating much fanfare. Productivity Thursday was yesterday – did anyone notice? Our good friends at the BLS are the custodians of this metric as well. According to their release yesterday, labor productivity in the US rose by 1.7 percent in the fourth quarter of last year. That is less than the 2.0 percent rate economists expected, and well below the productivity trends of decades long past – the last time we had a productivity surge in this country was in the late 1990s and early 2000s, when advances in information technology finally showed up in the real economy.

But hey – 1.7 percent is at least better than the minus 0.14 percent average rate from the beginning of 2021 to the present, as shown in the chart below.

What’s So Special About Productivity?

The underlying assumption for any capitalist economy is growth: things in the future will be more prosperous than things today because the rate of economic growth will outpace the rate of population growth (i.e., per-capita wealth, on average, will be higher tomorrow than it is today). Since about the last third of the nineteenth century, barring a small number of sustained downturns (most notably the Great Depression) that assumption has played out. The continuation of this long-term trend relies on two factors: demographics and productivity. Demographics refers to the percentage of the population actively employed in the labor force; a higher percentage of the population engaged in gainful employment means a lower dependency ratio (i.e. more independent souls working, and fewer dependent folk relying on those workers). Productivity is the measure of how much those workers can produce for every hour of labor. The more output per hour of effort expended, the higher the productivity. This is the formula for long-term growth; there is no alternative route to that goal of greater future prosperity.

Trouble On Both Fronts

The problem we face today is that demographic trends are headed in the wrong direction and, so far at least, there are few signs of improved productivity to pick up the slack. The demographic problem is twofold. First, a multi-decade tailwind of benign labor market conditions has effectively ended. This tailwind started in the 1970s with the increased entry of women into the full-time labor market (i.e., increasing the supply of labor relative to demand) and continued in the 1980s and 1990s with China’s entry into the global economy. The second demographic challenge is the dependency ratio we referred to above. Populations around the world are ageing, life expectancies are longer and people are having fewer children (and waiting longer to have them). In the very near future there will be fewer active workers to care for a larger number of older citizens requiring greater care.

The only solution to the demographic challenge is productivity. The good news, potentially, is that it there can be a meaningful lag between the time when a game-changing innovation takes place and when that innovation really kicks into economic activity. We noted earlier that this was the case with the last productivity surge – the technological innovations showing up in the economy’s performance in the late 1990s and early 2000s began in the 1960s with the advent of semiconductors and Moore’s Law. Going back even further in time, from the time electricity was invented in 1879 to the time when 50 percent of US households were switched on, in 1919, was a span of 40 years.

So it may well be that gains from some of the more recent areas of development – we think artificial intelligence and quantum computing may be at the forefront – are just around the corner. If so, they couldn’t come at a better time. Meanwhile, it would be worth one’s while to pay attention to Productivity Thursday, even if (or maybe especially because) nobody’s talking about it on CNBC.

MV Weekly Market Flash: PCE Seals the Memo

We have talked quite a bit in recent commentaries about the market’s odd habit of fighting the Fed throughout the monetary tightening period that began nearly one year ago. ps-metalsheet.com Even the jualbelilaptopbandung.com estimate.fsroofs.comEconomist magazine, one of the more sober and dispassionate corners of the financial media landscape, chimed in recently with the observation that “sometimes it’s okay to fight the Fed.” Hmm, maybe not so much. On the heels of a heady January when it sometimes seemed like we were headed right back to the bubble-blowing meme stock craze of 2021, the big news in markets over the past several weeks has been a repricing of expectations about the Fed’s likely terminal rate, interest rates in general, the US dollar and finally, it would appear, the stock market. If the market started to get the memo sometime after the latest FOMC meeting, the latest inflation report out this morning would seem to sign, seal and deliver that memo.

The Fed’s Go-To Metric

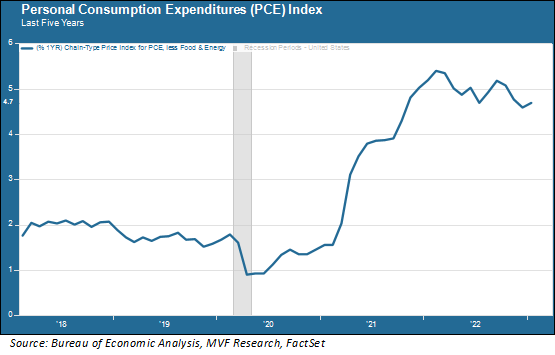
The Personal Consumption Expenditures (PCE) index is a lesser-known cousin to the more familiar Consumer Price Index, but it essentially performs the same function of measuring trends in consumer prices. The PCE, though, is the index the Fed uses as its main gauge of inflation for formulating monetary policy. Today’s report showed the PCE index (excluding the volatile categories of food and energy) increasing 0.6 percent during the month of January, translating to a 4.7 percent year-on-year gain. That was considerably higher than the 0.4 percent monthly gain (4.3 percent year-on-year) that economists expected, and it has not played very well so far this morning in marketland.

As you can see from the chart, inflation has leveled off at an elevated level (relative to where the Fed wants it) rather than come down significantly. Had the index done what the economists expected and grown at a 4.3 percent rate, the trend of slower increases that began last September would have continued; instead, the 4.7 percent rate represented an uptick from December’s 4.6 percent rate and thus a trend reversal. The composite picture for inflation, in fact, looks a lot like the “higher for longer” image that the Fed has been repeating ad nauseum in talking about where it sees interest rates.

Rates and Dollar Lead the Way

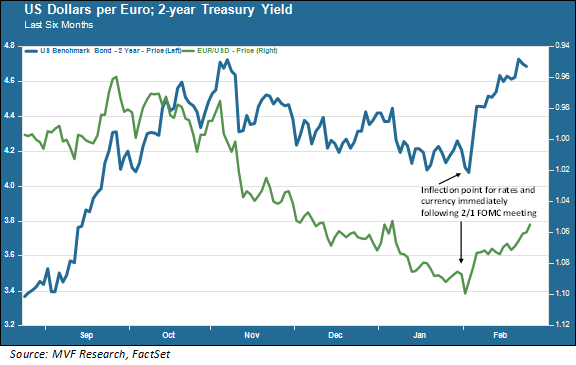
Today’s PCE report, of course, comes a full 24 days after the Federal Open Market Committee’s meeting on February 1. The interesting thing about that meeting, which we commented on at the time, was that the bond market and stock market came away with completely different interpretations. Stocks rallied hard on the notion that Jay Powell came off more dovish than expected, citing “disinflation” on several occasions and not pushing back too hard on looser financial conditions. But interest rate-sensitive yields like the 2-year Treasury had a different take entirely, and yields shot up. So did the US dollar against other major currencies.

As for stocks, the immediate post-FOMC euphoria gradually turned cooler, with shares mostly treading water until the more decisive downward trend of the past two weeks. We don’t find that overly surprising given how fast the market went up in January (and how much of that rally was fueled by some of the junkier corners of the market, having more to do with the covering of short positions than anything else). In our annual outlook last month we expressed our belief that markets are likely to be volatile for much of the first half of the year, but that if our base case assumption of a relatively brief cyclical economic downturn plays out (as we still think is the case) then market conditions could stabilize and turn firmer in the second half. As always, we caution that there is plenty of room for surprises between now and then that would necessitate a change of view.

Slava Ukraini

We would be remiss to not observe that today marks the one-year anniversary of the war in Ukraine, an event that sadly continues its unrelenting course of death and destruction. Those of us far away from the conflict can count our blessings that the war’s impact on the global economy has been less harmful than many of us originally feared. Notably, oil and gas prices have retreated from their highs reached in the immediate aftermath of Russia’s unprovoked invasion. But the war is not over, and the outcome is far from certain both in terms of the economic damage it could cause and, importantly, the implications for democracy and freedom in the world order. We are heartened by the continued strength of the Western alliance supporting Ukraine, made visible earlier this week by President Biden’s historic visit to Kyiv. But there is much left to be done. Our hearts go out to all those whose lives, livelihoods and loved ones have suffered the terrible consequences of this war, and we pray for better times ahead. Slava Ukraini.

MV Weekly Market Flash: No Landing, Or Delayed Landing?

One of the phrases making the rounds among the financial media chatterboxes this week has been “no landing.” This is the too-cute-by-half riposte to the usual dual-choice framework of “hard landing” or “soft landing” when issuing an opinion on where the economy finds itself as the Fed finishes off its monetary tightening cycle. Last week’s barnstorming jobs report gave some octane to the no-landing narrative. So did this week’s retail sales print, showing that consumers spent at a rate roughly double that of economists’ forecasts in January. Over in Europe, the freakishly balmy weather this winter has served up seems to have taken all fears of a severe crunch off the table – natural gas prices there are at an 18-month low and down roughly 85 percent from their nosebleed highs last August.

So all good and its back to the brandy, eh? Perhaps not. The macro news has indeed given some cause for cheer relative to some of the more dour scenarios we’ve been looking at in the past few months. We’ll take the best unemployment rate since before the 1969 moon landing, for sure. But “no landing” is a misleading sentiment. The economy is starting to slow down – that is evident from the vast majority of corporate management calls we’ve been tracking this earnings season. It’s a question of when, not if.

Debt and Delinquency

Household debt rose to a record level of $16.9 trillion at the end of last year, according to a report released yesterday by the Federal Reserve Bank of New York. As a percentage of household income that is still not at the levels we saw in 2007, just before the onset of the Great Recession. Back then the debt-to-household income level reached a peak of 123 percent; at present it is 91.5 percent. But the trend has been steadily increasing. Credit card balances rose to $986 billion in the fourth quarter according to the New York Fed report, easily surpassing the pre-pandemic high of $927 billion. Delinquencies are increasing too; while still not at red flag levels by historical standards they are substantially higher across most categories, including home mortgages, credit cards and auto loans, than they were a year ago. And households have lost that savings cushion they got during the pandemic; household savings as a percentage of household income is at its lowest level since the beginning of this century.

Prices and Rates

Whether the economic slowdown turns into a recession or not, and if so for how long, depends mainly on consumer spending as that single metric accounts for nearly 70 percent of total GDP. When we look at where companies have been showing sales growth for the past twelve months, much of it has come from pricing power. Sales is a function of volume and price; how many units of something you sell, and at what price. For many companies especially in the consumers goods space, that function has largely gone as follows: we sold fewer units but we sold them at higher prices, so the net effect was that our sales grew. Customers happily (or maybe grudgingly but still willingly) paid whatever price was on tap.

That dynamic will change as a result of (a) increasingly constrained household budgets from the combination of more debt and wages that are not keeping up with inflation; (b) consumer price inflation that is still running well above recent norms; and (c) higher interest rates that make the cost of credit more expensive (and those outstanding credit card balances more onerous). Companies are guiding towards lower profit margins as they need to mark down prices in order to clear inventory. Layoffs are spreading beyond the tech and financial sectors where they have been going on for half a year. At some point – and sometime in the second half of this year is our best guess as to when – we think these factors will come together and (as we set out in some detail in our annual outlook last month) produce a cyclical recession. Not a deep, grinding recession of the type experienced in 1980 or 2008, but perhaps of a piece with the 1990 downturn.

Those other macro factors that have been giving folks cheer as of late – they are real and they will likely help cushion the impact of the downturn. But to return to the air traffic control language so dear to the economic conversation, we don’t see the plane as avoiding a landing altogether. It may circle the runway a couple times, but the pressures on consumers will, we believe, bring that plane down in the not too distant future.

MV Weekly Market Flash: Making Sense of the Split Message

Like many of our peers in the industry, we have spent much of the past few months looking at the bond market from every angle, shaking it, turning it upside down and trying to figure out what message it is sending. At face value there doesn’t seem to be a single, consistent message here. Credit risk spreads – i.e. the additional compensation investors are supposed to demand for holding riskier assets than super-safe government bonds – remain tight. The current spread between Baa investment grade corporates and the 10-year Treasury yield is 1.8 percent, as compared to the three-year average of around 2.2 percent. Over in high yield land the ICE BofA High Yield Bond index currently yields 7.9 percent, compared to a high of 9.5 percent last fall and well below the yields normally seen during economic slowdowns.

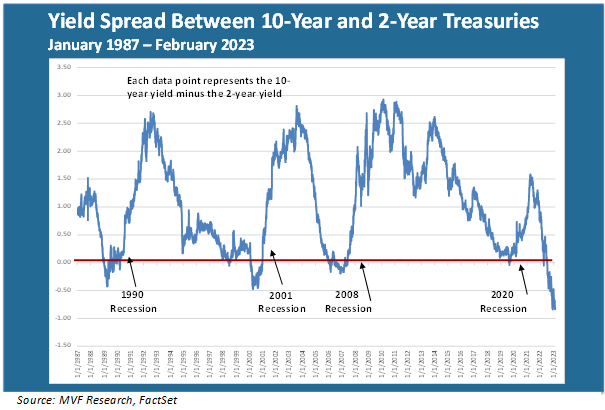
But while credit risk spreads seem to be telling us that everything is fine and dandy, the Treasury yield curve is more deeply inverted than it was at any time during the four previous recessionary periods.

Nobody knows for certain, of course, what the economy is going to look like later this year, but the consensus among economists is that we will have a slowdown with a decent likelihood of a shallow recession (the shallow recession is our base case view, as we have communicated in previous commentaries). So when we consider the depth of the current inversion, what comes to mind is that perhaps the shape of the curve is not as much about signaling a recession as it is about other things. But what other things?

Yesterday On Their Minds

The vast literature of behavioral finance may offer some clues about what is going on with the bond market’s seemingly split message that may in fact be not so split at all. One facet of human predilections flagged by behavioral economists is a recency bias. That’s when your expectations about future outcomes are rooted in your experience from the recent past. For bond investors, the single most salient element of recent history was ZIRP – the zero interest rate policy that dominated the post-2008 financial crisis environment and influenced fixed income instruments of all types and maturities. The average 10-year Treasury yield from the beginning of 2010 to the end of 2021 was 2.19 percent. Short-term rates, of course, were closer to the zero lower bound of the Fed funds rate.

If you assume that the 2010 – 2021 cycle represents some kind of natural norm for any future growth cycle, then it’s easy to see why you might be bidding up 10-year Treasuries today (i.e. putting upward pressure on prices and downward pressure on yields). The 10-year today is at 3.7 percent, the Fed is closer to the end than the beginning of its tightening cycle, the recession (if it happens) will be brief and then things go back to where they were. If 10-year paper is back around two percent twelve months from now, then holding bonds with a 3.7 percent yield looks pretty smart.

Thinking About Tomorrow

The problem with recency bias, of course, is that the immediate past is not likely to be an accurate guide for the characteristics of the next cycle. We already have a pretty good sense that one major component of the economy – the jobs market – is not going to look much like the experience of recent decades. Structural demographic trends are starting to come into play, and these trends have the potential to keep some degree of upward pressure on inflation. That, in turn, may have an impact on where the Fed decides interest rates have to be as the current tightening cycle transitions to something else. We do not expect that the Fed will start cutting rates any time soon; even when it does, nothing we see today suggests that we are headed back for a reprise of the ultra-easy money conditions of the 2010s.

To sum it all up: we think the face-value split message between tight credit spreads and the inverted yield curve is not really a split message, in that the reason for the inversion has less to do with fears of a looming recession than it does with general views about interest rates anchored in the experience of 2010 to 2021. That’s where we see potential mispricing, because if the Fed is not going to cut rates dramatically (because this next economic cycle is not going to look like the last economic cycle) then we should not assume that a 10-year yield of two percent is where we wind up in another year or two. We’ll know more as we see data about growth, prices and jobs come in over the next few months. But we think this might be a good time to resist that behavioral trap of recency bias.

MV Financial

Meet Our Team

Smart Strategies.

Investment Advisor Company