Meet Our Team
MV Weekly Market Flash: Inflation and the Fed
MV Weekly Market Flash: The Performance Bar Gets Higher
MV Weekly Market Flash: Consumers Flash Some Warning Signs
MV Weekly Market Flash: Questions About Quantum
MV Weekly Market Flash: The Tribulations of Kevin Warsh
MV Weekly Market Flash: Unruly Brittania
MV Weekly Market Flash: The Vibes Versus Reality Gap
MV Weekly Market Flash: The Jobs Market Is Not OK
MV Weekly Market Flash: The Alfred E Neuman Market Returns
MV Weekly Market Flash: The Importance of the Up Days

MV Weekly Market Flash: Inflation and the Fed

Read More From MV

As of this past Wednesday’s market close, the S&P 500 had retreated by around 4.5 percent from its recent all-time high, set on June 2. The Nasdaq, home to a bevy of the AI-related names central to the market’s fortunes this year, had given up 7.1 percent from its most recent high water mark. There’s nothing particularly unusual about a drawdown of these magnitudes after a sustained run upwards. We make a note of every time the S&P 500 loses five percent or more followed by a recovery of at least that much, something which has happened 90 times since...

Read More

MV Weekly Market Flash: The Performance Bar Gets Higher

Read More From MV

You would have needed a pole vault to get over that bar. The expectations bar, that is. On Wednesday after the market close, US chipmaker Broadcom released its sales and earnings report for the second quarter (second fiscal quarter, corresponding to the first calendar quarter ended March 31). kantarawichai.mahasarakham.police.go.th Broadcom’s sales rose 48 percent year-on-year, and the company’s forward guidance for the quarter to come topped consensus estimates. The Palo Alto-based chipmaker is smack in the middle of the hottest story – arguably the only story – driving US stock market growth this year. Pretty good results, one might have...

Read More

MV Weekly Market Flash: Consumers Flash Some Warning Signs

Read More From MV

The American consumer is the stuff of legend. Resiliently spending her way through the best and the worst of times, the consumer is the iconic emblem, the longstanding growth machine of the great US economy, accounting for nearly 70 percent of total gross domestic product year in and year out. Small wonder, then, that economists and other students of the market closely follow the minutiae of consumer data, from retail sales to personal consumption expenditures to household sentiment surveys. Struggling to Keep Up Many of these data points have been holding up better than expected recently. But there are some...

Read More
MV Weekly Market Flash: Questions About Quantum

Read More From MV

Nobody understands quantum mechanics. akarisakura-official.com That’s according to the late Richard Feynman, and as one of the greatest physicists of the twentieth century, he was in a good position to opine on the subject. As mind-bendingly counterintuitive as the subject is, though, it is showing up in all kinds of technological spaces these days. Including the stock market. volkovlaw.com The chart below shows the two-year performance of three companies engaged in various approaches to the challenge of developing a quantum computer: IonQ, Rigetti Computing and D-Wave Quantum. That blue dotted line plodding along below these three companies is the S&P...

Read More

MV Weekly Market Flash: The Tribulations of Kevin Warsh

Read More From MV

May the odds be ever in your favor. That was the cynical sentiment expressed to those unfortunate souls selected for participation in the “Hunger Games,” the much-read and much-seen saga by author Suzanne Collins. With a 95.83 percent chance of death in that contest (23 out of 24), the odds were most definitely not in one’s favor. Now, Kevin Warsh did not come into his new post as chairman of the Federal Reserve through any “reaping,” as per the protocols of the Panem games in the fictitious series. This is, arguably, his dream job. Unfortunately for him, though, the state...

Read More

MV Weekly Market Flash: Unruly Brittania

Read More From MV

Ten years ago, in 2016, it was Great Britain that fired the opening salvo in what would come to be recorded as a very disruptive year in global politics. sonae.projects.coppertable.co.za ipatineteelectrico.com The decision to leave the European Union took place that summer as British citizens stuck it to the man – if only by a couple percentage points – and buckled in for whatever might or might not happen next. YOLO, as the kids were still saying back then. A few months later, Americans likewise flipped off the Establishment as they handed Donald Trump a presidential victory over Hillary Clinton,...

Read More

MV Weekly Market Flash: The Vibes Versus Reality Gap

Read More From MV

In the wonderful world of economic analysis we have hard data and soft data. These two things have been at odds with each other for some time, keeping those who try to supply insights and explanations about the data, ourselves included, asking why. We will try to come up with some answers as we delve into this topic today. Let’s establish some basic definitions. By hard data we mean the numbers associated with macroeconomic performance metrics, the big three of which are arguably growth (GDP), prices for goods and services (inflation), and the availability of jobs (payrolls and the unemployment...

Read More

MV Weekly Market Flash: The Jobs Market Is Not OK

Read More From MV

The monthly jobs report from the Bureau of Labor Statistics will come out in two weeks from today. Do you want to hazard a guess as to the number of nonfarm payroll (NFP) gains reported for the month of April? Good luck with that – see below. In the past fifteen months we have had nine months of payroll gains and six months of payroll losses, according to the BLS data. And this chart doesn’t reflect an even more bizarre facet of the BLS report, in which initial estimates are subject to sweeping revisions. Case in point: the initial report...

Read More

MV Weekly Market Flash: The Alfred E Neuman Market Returns

Read More From MV

On Wednesday this week the S&P 500 stock index closed above 7,000 for the first time ever, and thus gave traders the thrill of two big things on the same day: a nice round number (oh, how we love crossing the round number thresholds), and a record close to boot! So the stock market has clawed back all its losses since the onset of the Middle East war, and then some. Is this the dawn of another one of those magic carpet rides the market takes us on from time to time, or is there potentially cause for a pause?...

Read More

MV Weekly Market Flash: The Importance of the Up Days

Read More From MV

Patience and discipline. This is the mantra we have been encouraging our clients to embrace from day one. The past several weeks has constituted one of those times when following that mantra is exceptionally important. It is also exceptionally hard, because it requires control over our very powerful lizard brain impulses of fear and greed. An Anthology of Disruption Because it is hard to practice the art of patience and discipline when markets go pear-shaped, we pay very close attention to the facts around disruptive events. Specifically, we have documented every drawdown in the S&P 500 of five percent or...

Read More

MV Weekly Market Flash: Inflation and the Fed

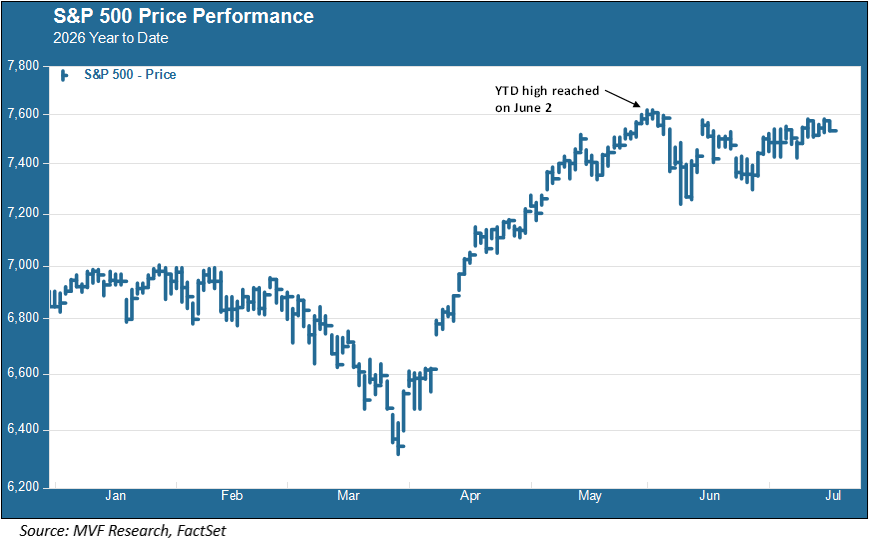
As of this past Wednesday’s market close, the S&P 500 had retreated by around 4.5 percent from its recent all-time high, set on June 2. The Nasdaq, home to a bevy of the AI-related names central to the market’s fortunes this year, had given up 7.1 percent from its most recent high water mark. There’s nothing particularly unusual about a drawdown of these magnitudes after a sustained run upwards. We make a note of every time the S&P 500 loses five percent or more followed by a recovery of at least that much, something which has happened 90 times since the beginning of the twenty-first century. As always there are multiple factors at play. Stretched valuations have caused another round of second-guessing on the AI narrative, as we discussed in our commentary next week. barbarossaleatheroverstock.com The SpaceX IPO and subsequent (expected) debuts by Anthropic and OpenAI could add more third-guessing and fourth guessing to this space, with near-term risks both to the upside and downside. ksa.yadawi.org What concerns us more broadly, though, is the specter of inflation that has been looming over everything for the past several months. On Thursday the European Central Bank became the first of the G7 central banks to raise interest rates following the recent cycle of monetary easing, citing higher inflationary risks and also revising its growth estimates down. beijingxiantour.com That sets up a challenge that the Fed will face when the FOMC meets next week.Shades of 2022

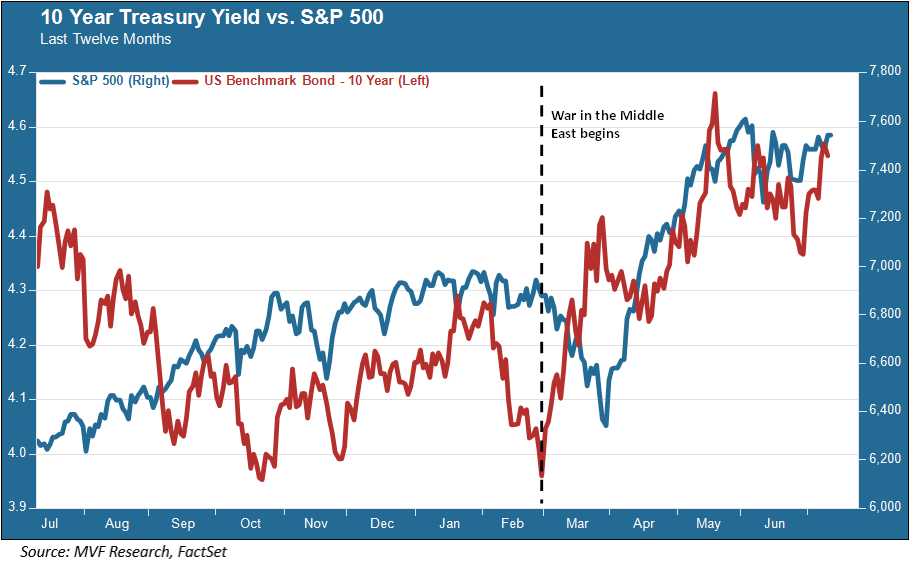
The stock market has been impressive (some might say complacent) in its efforts to ignore that the war in the Middle East is still going on, three and a half months after it started, without an obvious path to conclusion. Investors do seem to have wised up enough, though, to stop engaging in rapturous cartwheels every time Axios comes out with yet another “deal is just around the corner” headline. Inflation had been sticky before the war started, but it has since gone from sticky to uncomfortably higher.

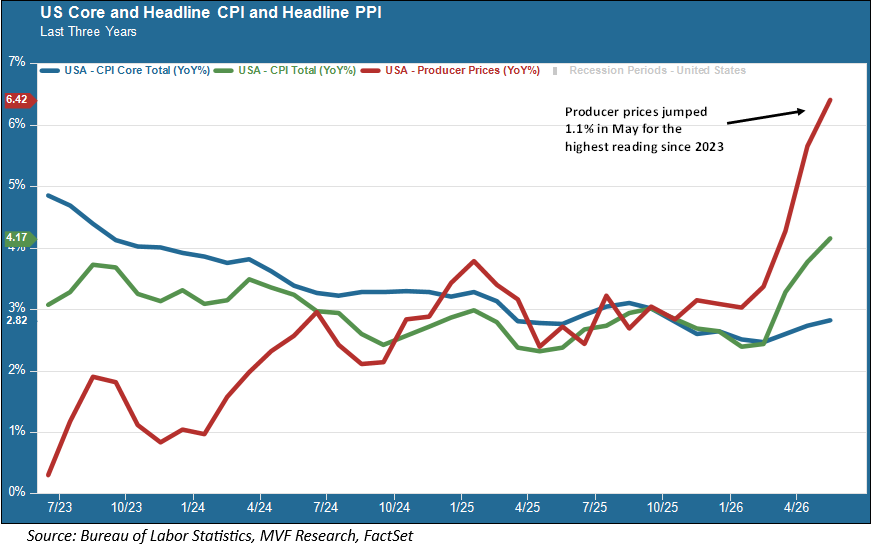
Energy, of course, has been the main influencing factor pushing prices skyward as both the headline consumer price index (CPI, in green) and producer price index (PPI, in crimson) show. But core CPI (blue), which excludes energy as well as food prices, has also trended up since the war started. Producer (wholesale) prices in particular are rising by more than any time since 2022-23, at the peak of the post-Covid inflationary spike. Higher energy prices mean higher input costs for pretty much any business, and either those costs will get eaten by the business itself (lower profit margins) or get passed onto the consumer (higher prices for you and us).

It could be worse. Oil prices, while higher than before the war, are lower than some of the worst-case scenarios being spun after the Strait of Hormuz closed, which had crude oil prices pushing up past $150 per barrel. That hasn’t happened for several reasons, including a dramatic decrease in oil imports by China, which has been relying on other sources including inventories and alternative energies to meet its needs. But the longer the war persists, the more households and businesses will build higher inflationary expectations into their budgeting plans. Once these expectations become structural, they are very hard to dislodge – this is how inflation turned into a decade-long problem in the 1970s.

The Jobs Puzzle

But inflation is not the only macro variable putting pressure on the near-term outlook for stocks. Last Friday’s jobs numbers went over like a lead balloon. Meaning, of course, that the BLS report itself was upbeat, with 172,000 nonfarm payroll gains versus 100,000 expected, and the unemployment rate staying put at 4.3 percent. This was one of those time-honored “good news is bad news” events, as the Fed is even less likely to take a dovish position on rates when conditions in the labor market are healthy.

But are things actually all that great for jobs? Layoffs keep happening in large numbers. The May report on layoffs by Challenger, Gray and Christmas was up 16 percent from April and the highest number of layoffs for any May since 2020 (when pandemic-related layoffs were in full swing). The job market for recent college graduates is in terrible shape, with AI-generated resumes getting ghosted by AI hiring algorithms and nary a human to be found in the process. So far the evidence is anecdotal, but some concerning signs are evident. Additionally, the upbeat BLS May jobs report is thought to be due in no small part to one-off hiring in areas like hospitality and leisure ahead of the World Cup, which began this week.

So, we have lots more questions than answers. Again, we see the potential for near-term risks skewing either up or down. Uncertainty can cut both ways. But inflation seems set to remain a problem, potentially beyond the rest of this year, and we would very much like to be proven wrong on this front.

MV Weekly Market Flash: The Performance Bar Gets Higher

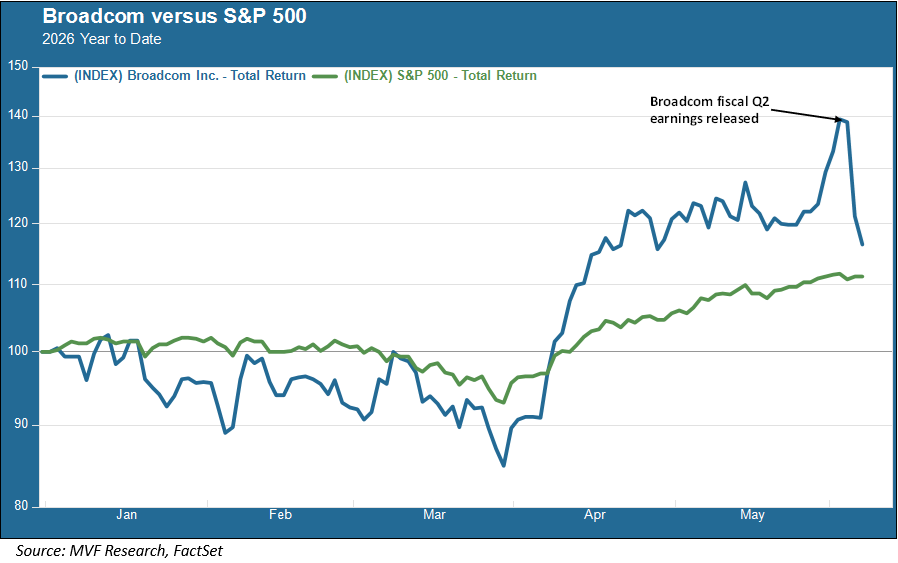
You would have needed a pole vault to get over that bar. The expectations bar, that is. On Wednesday after the market close, US chipmaker Broadcom released its sales and earnings report for the second quarter (second fiscal quarter, corresponding to the first calendar quarter ended March 31). kantarawichai.mahasarakham.police.go.th Broadcom’s sales rose 48 percent year-on-year, and the company’s forward guidance for the quarter to come topped consensus estimates. The Palo Alto-based chipmaker is smack in the middle of the hottest story – arguably the only story – driving US stock market growth this year. Pretty good results, one might have thought. But one would have been mistaken, at least in the context of what occupies the mind of the market. Broadcom shares plunged more than 12 percent yesterday, one of the biggest single-day losses on record, as investors apparently decided that even though the forward estimates beat the median forecast, they didn’t beat the most optimistic estimates. The freefall is continuing in the early hours of trading today, and the stock is now around 17 percent off where it started yesterday. ppid.pnk.ac.id demo.youaddon.com

Here We Go Again with Productivity

The eye-popping magnitude of the Broadcom drop notwithstanding, the context around it is something we have seen time and again ever since OpenAI introduced ChatGPT to the world back in the latter months of 2022. Every now and then, the furious pace of investment in AI infrastructure and compute – the so-called “tokens” that are the basic units of AI brainpower – has been popped by a counternarrative questioning whether all this money was ever going to produce something genuinely productive and business-enhancing for its end users. There was a Goldman, Sachs research piece asking that exact question all the way back in the summer of 2023. Last year we had an MIT report in which 95 percent of companies using generative AI in some form claimed that their pilot programs were not delivering a clear financial return. And just last week, the chief operating officer of Uber introduced “tokenmaxxing” to the large swath of humanity unfamiliar with that term, noting that it was increasingly difficult to justify the amount being spent on AI tokens relative to their measurable effect on productivity. Just in time, perhaps, to frame the debate into which that hapless Broadcom earnings report came out this week.

Another False Rotation?

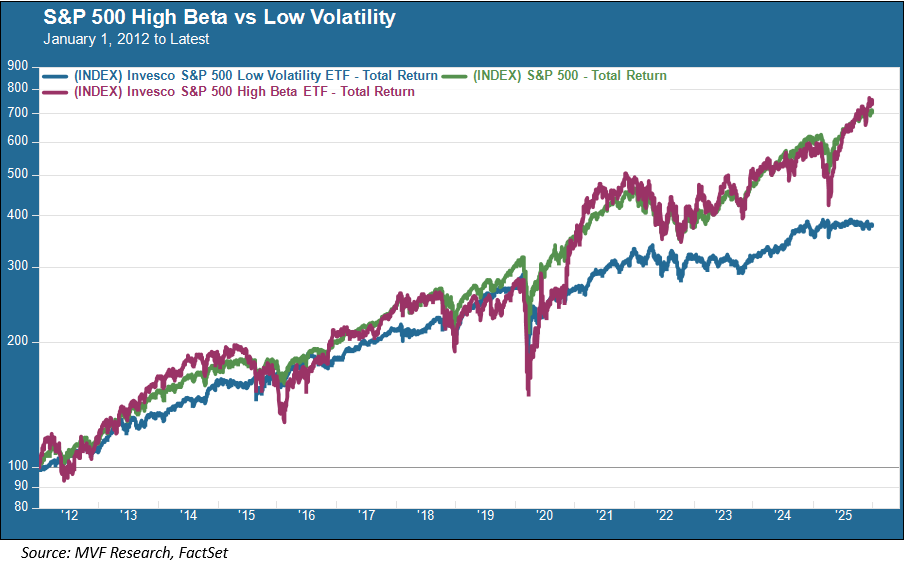
Whenever the AI counternarrative manages to score a hit against the dominant momentum, the inevitable question comes into play: to wit, is this now the moment when all the dishwater-dull laggards come out from behind the rocks and take charge? A look at recent history would suggest caution when debating whether to go pedal to the metal on any such rotation, because they have shown themselves to be short-lived. The chart below shows the performance of low-volatility versus high-beta (beta is a measure of relative volatility) stocks for the past 14 years, going back to the beginning of 2012 (the ETFs shown here were incepted in the middle of 2011). We think the high-beta / low-vol comparison is better for this purpose than, say, the old metric of value versus growth, because the AI trade has been pretty much entirely a high-beta story, while the waters are a bit muddier in the value / growth differential.

As the chart shows – and what should probably strike you as intuitive – is that in periods where things go sour, those high-beta stocks can fall much farther. A brief China shock in 2015, rising interest rates in 2018 and 2022, and the initial Covid shock in March 2020 all depict such periods. But the recovery from each downturn has tended to be quick, and over the entirety of the period the performance gap is notable, with the high-beta index returning nearly double its low-vol counterpart. Makes sense, right? Higher risk needed to obtain higher returns (though that Finance 101 tenet has always had its share of challengers, which is how “low volatility” offerings got to be a thing in the first place).

We will not be surprised if the stocks affected by the latest AI blowback turn around in the very near future, given that – tokenmaxxing chatter aside – there isn’t much evidence yet of any meaningful reversal to demand for all things infrastructure and compute. The buy-the-dip impulse among punters seems to be more frenetic than ever these days. But we will continue to take the counternarrative seriously, too, because it really still is an open question as to how all of this translates into measurable productivity. And we have some potentially major structural disruptions ahead, with both Anthropic and OpenAI on track to enter the public markets in the coming months. Not to mention the unwieldly behemoth SpaceX, about which we will no doubt have to share our opinions at some point in the not too distant future, whether we want to or not. In other words – both the narrative and the counternarrative are going to require close scrutiny in the weeks ahead.

MV Weekly Market Flash: Consumers Flash Some Warning Signs

The American consumer is the stuff of legend. Resiliently spending her way through the best and the worst of times, the consumer is the iconic emblem, the longstanding growth machine of the great US economy, accounting for nearly 70 percent of total gross domestic product year in and year out. Small wonder, then, that economists and other students of the market closely follow the minutiae of consumer data, from retail sales to personal consumption expenditures to household sentiment surveys.

Struggling to Keep Up

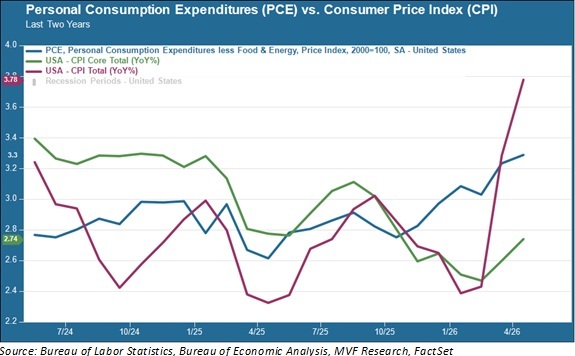
Many of these data points have been holding up better than expected recently. But there are some growing signs of pressure that may bode for a troubled summer ahead. Data recently released by the New York Fed shows that 90-day credit card delinquencies for the first quarter of this year rose to just over 13 percent, the highest figure recorded since the immediate aftermath of the global financial crisis. The savings rate, meanwhile, has fallen to its lowest level since 2022. Other data show that a growing number of households are dipping into retirement savings and taking out more debt as they struggle to keep up with rising inflation. The inflation rate was sticky even before the war in the Middle East began two months ago, and it has been trending up steadily ever since.

In the above chart we see the surge in energy prices producing a jump in the headline Consumer Price Index (CPI, crimson line), but also the steady rise in the core Personal Consumption Expenditure (PCE) index, the Fed’s preferred metric (blue line) which excludes the food and energy categories, and the core CPI number (green line) for good measure. The core PCE index is at its highest level since 2023, and it suggests that inflation is now about more than just higher gas prices, but is starting to make itself felt in a wider range of goods and services. Consumers are very much aware of this. In the latest Conference Board Consumer Confidence index, published earlier this week, two-thirds of respondents said that they will be cutting back on spending in the next six months due to higher prices, with the biggest cutbacks coming in discretionary and big-ticket items.

The Fed’s Dilemma

Consumers aren’t the only ones concerned about higher prices. A bevy of Fedspeak this week reflected a growing sense among the nation’s monetary policy stewards that a continuation of the present inflation trend could make the next change in interest rates a hike rather than the long-awaited cut. Investors are already pricing in a likely rate hike of 0.25 percent by the first quarter of next year. When the Federal Open Market Committee reports next on June 17, we will see whether the market’s outlook is matched by the Summary Economic Predictions that will accompany the FOMC’s press release. As of the prior SEP, a couple months ago, the median expectation was still for two rate cuts this year. We do not think that assumption will hold. To add to the drama, this will be the first FOMC chaired by Kevin Warsh, and may be an indication of changes afoot as the new Fed chair attempts to make his mark on the proceedings.

We do not expect to see rates move either up or down at the June meeting. There is still much that we don’t know about how structural the current inflationary trend will be, or how long it will take for the disruptions caused by the crisis in the Strait of Hormuz to work themselves out. One encouraging sign from that Consumer Confidence report cited earlier was that households’ inflationary expectations, while elevated, did not rise measurably from the previous month. In the 1970s, it was the wage-price spiral driven by expectations that produced the structural inflation of that decade – a feedback loop that went off the rails until the dramatic monetary policy actions of the Paul Volcker Fed at the end of the decade. We are nowhere near those levels today, and hopefully we won’t be there tomorrow. Meanwhile, we will need to keep a close eye on the consumer-facing data as they come in over the coming weeks.

MV Weekly Market Flash: Questions About Quantum

Nobody understands quantum mechanics. akarisakura-official.com That’s according to the late Richard Feynman, and as one of the greatest physicists of the twentieth century, he was in a good position to opine on the subject. As mind-bendingly counterintuitive as the subject is, though, it is showing up in all kinds of technological spaces these days. Including the stock market. volkovlaw.com The chart below shows the two-year performance of three companies engaged in various approaches to the challenge of developing a quantum computer: IonQ, Rigetti Computing and D-Wave Quantum. That blue dotted line plodding along below these three companies is the S&P 500. p3m.pnk.ac.id

The Qubit of It All

The above chart reflects not just the eye-popping returns for these companies, but also the considerable risks involved for something that…well, doesn’t quite exist yet in a fully functional form. If you bought into Rigetti Computing two years ago, you would be up more than two thousand percent cumulatively. If your cost basis was October 2025, on the other hand, you would be down by minus 54 percent as of today’s prices —  good for tax loss harvesting against all your AI winners, maybe, but not much else.

So where exactly are we in this brave new world of computers powered by qubits? Unlike the ordinary bits that make up the building blocks of classical computers, each of which can take a value of either zero or one at a discrete point in time, qubits can exist in a so-called superposition of all states between those numbers at the same time. That should give quantum computers vastly superior performance over their classical peers in the run-time needed to solve extremely complex problems.

But getting these qubits to behave properly is a daunting challenge. A qubit works – for the purpose of quantum computing – when it is in that superposition state, but it only remains that way for a tiny fraction of a second. Adding more qubits to a system creates interference as individual qubits pop in and out of their fragile superposition states, creating an unwieldly amount of cross-talking noise. That makes it hard to scale up to a size commensurate with what would be considered a fully operational quantum machine. There is considerable debate among experts in the field as to when this scalability will be achievable – from a couple years from now to a quarter century or more away. That’s a pretty wide time gap.

All Roads Lead to Somewhere

Which of the various technologies being tried out today will get to that big milestone of an industrial-size quantum computer with acceptable levels of interference? Are we going with superconducting circuits, or trapped ions, topological qubits or other modalities that so easily roll off the tongue? Right now – as the above chart suggests – investors are casting their nets wide rather than going all-in on any one thing that may wind up a dead end. The parallels with artificial intelligence can be seen here, where a thousand flowers bloomed and faded in the world before ChatGPT (and arguably, that debate is not finalized either, as the race for less costly and energy-intensive systems with fewer hallucinations continues in AI land).

Steady progress is being made, though, and along with the potential benefits from quantum computing in areas such as drug discovery, there are plenty of threats. One of the first practical uses identified for a machine running on qubits was cryptography, or the ability to crack the most complex of security codes. That presents an obvious challenge to the integrity of cybersecurity systems. In today’s Financial Times, an article titled “Crypto industry braces for quantum threat” described how a post-quantum world could pose a lethal threat to the security of the code powering the blockchain, upon which the cryptocurrency bitcoin rests. As if we didn’t already have enough to worry about with AI hacking superpowers like Anthropic’s Mythos out there lurking around. Whether it’s two years or two decades, we need to be plugged into what is going on in the trippy quantum world, ready to take advantage of the opportunities and to take defensive actions against the threats.


MV Weekly Market Flash: The Tribulations of Kevin Warsh

May the odds be ever in your favor. That was the cynical sentiment expressed to those unfortunate souls selected for participation in the “Hunger Games,” the much-read and much-seen saga by author Suzanne Collins. With a 95.83 percent chance of death in that contest (23 out of 24), the odds were most definitely not in one’s favor. Now, Kevin Warsh did not come into his new post as chairman of the Federal Reserve through any “reaping,” as per the protocols of the Panem games in the fictitious series. This is, arguably, his dream job. Unfortunately for him, though, the state of the global economy today means that the odds are in his favor about as much as for some hapless tribune from District Eleven or wherever.

No Room for Rate Cuts

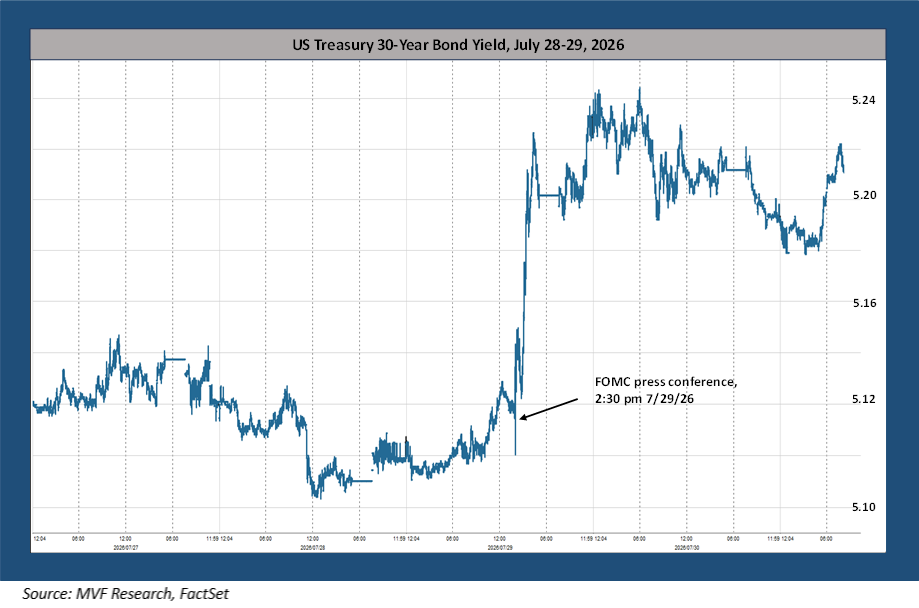
Warsh takes the baton from outgoing Fed chair Powell today (Powell will be staying on for the foreseeable future as a regular Board governor). This morning, bond yields jumped for a variety of reasons mostly linked to the persistence of high energy prices, with resulting upward pressure on consumer and producer prices, and the apparent lack of any kind of definitive action coming out of this week’s summit meeting between the US and China. The 30-year bond yield is at its highest level in recent history.

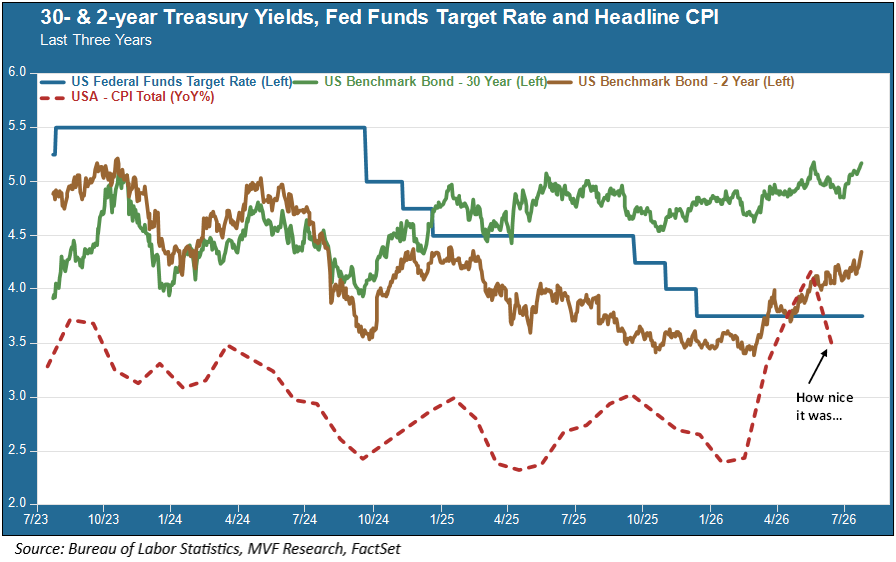
Bond market investors have taken stock of the inflation situation and concluded that there will be no interest rate cuts in 2026, with doubts even as to their likelihood in the first half of 2027. Core inflation, as shown in the chart above, remains well above the Fed’s target rate of two percent, a level last seen in 2021. Core inflation excludes the volatile categories of food and energy, thus not directly reflecting the spike in fuel prices since the beginning of March. But those higher energy costs eventually work their way into the broader economy, as seen in the chart above (the green line). Conditions are even worse at the wholesale level. The headline Producer Price Index (PPI) for April, as reported on Wednesday this week, came in at 6.0 percent year-on-year while the core PPI jumped to 5.2 percent. With the Fed’s mandate to maintain stable prices front and center, this is no environment for a rate cut.

Unfortunately for Mr. Warsh, he comes into the job with at least one extremely powerful individual expecting him to do just that. Trump is not exactly known for a keen appreciation for the judicious use of monetary policy to address the economic realities of a given place and time. In about one month’s time, on June 17, Warsh will be captaining his first Federal Open Market Committee meeting, marking the Fed’s first call on interest rates under his leadership. Now there is, of course, a non-zero possibility that conditions will change so much between now and then that a rate cut could be up for discussion. We would put the odds of that somewhere below the odds of emerging as the victor in the Hunger Games, but one never knows for sure.

Catching Fire

Kevin Warsh has a deep knowledge and sound understanding of how the economy works in all its component parts. At least based on much of his past record, he is instinctively a hawk when it comes to the task of managing inflation. More than his technical skills, though, he is going to need to draw on all his skills in the art of diplomacy to thread his way through the political expectations of the White House and the sober, technocratic analysis of his eleven fellow voting members on the FOMC. The traditional role of the Fed chair, when it comes to the FOMC, is to steer the members to a unified consensus on what action to take. His predecessors, for the most part, succeeded in that role (post-Arthur Burns, anyway).

On June 17 we will get to see whether Warsh has the diplomatic chops to produce a harmonious decision on policy without unleashing a firestorm of social media invective from down the street. Perhaps he should take some pointers from Katniss Everdeen, heroine of the Hunger Games who exuded diplomatic charm along with streetfighting smarts as she clawed her way through the tribulations of fending off her potential killers, those both in the arena with her and in the backstabbing halls of power in the Capitol. Good luck Mr. Warsh. Through your efforts and skills, we hope that the odds actually will be in your favor, sooner rather than later.

MV Weekly Market Flash: Unruly Brittania

Ten years ago, in 2016, it was Great Britain that fired the opening salvo in what would come to be recorded as a very disruptive year in global politics. sonae.projects.coppertable.co.za ipatineteelectrico.com The decision to leave the European Union took place that summer as British citizens stuck it to the man – if only by a couple percentage points – and buckled in for whatever might or might not happen next. YOLO, as the kids were still saying back then. A few months later, Americans likewise flipped off the Establishment as they handed Donald Trump a presidential victory over Hillary Clinton, the living and breathing paragon of the establishment if ever there was one. soragroup.vnDead and Buried

Here we go again. Election results for English council seats and the parliaments of Scotland and Wales are still being tallied, but enough of the vote has been counted so far to say that the results are a flat-out disaster for the two parties – Labor and the Conservatives (Tories) – that have dominated UK politics for the entirety of the postwar system. To the right of the Conservatives stands the Reform Party, an ethno-populist movement that is swallowing up the lion’s share of the votes being hemorrhaged by Labor and the Tories. As of this writing, with 63 of 136 councils determined, Reform has seen a net gain of 515 council seats while Labor is facing a net loss of 288 and the Conservatives a net loss of 204.

The Green Party, a left-leaning progressive movement, is also adding seats. Its leader, Zack Polanski, pronounced the two-party system “dead and buried” after the Greens won a crucial mayoral contest in Hackney, a borough in Inner London. The Greens are also expected to pick up their first constituency seats in Scotland, where the make-up of parliament is at stake with the overall winner expected to be the Scottish National Party, again displacing Labor. Similarly in Wales, the 30 year rule of Labor is set to end with just 10 or so of the 60 parliamentary seats with the national (Welsh) Plaid Cymru Party and Reform picking up much of the rest.

Relics of a Bygone Order

We decided to spend some time talking about the UK elections this week because we see this as part and parcel of the same phenomenon we were talking about last week, namely, the widespread and deep-seated disillusion being felt in so many households in so many parts of the world. Last week, you will recall, we highlighted the dismal numbers reflected in the University of Michigan household sentiment report – the lowest in 66 years’ worth of data. Well, we got the latest Michigan survey numbers this morning and they are even worse than the previous ones, for a second straight month of record lows. Dissatisfaction with the direction of consumer prices, anxiety about their future prospects and lack of trust in the country’s institutions are all in the mix. These are the same sentiments being reflected across the pond today as voters turn their back on the once-reliable two party system of an age gone by.

Here in the US we don’t have a parliamentary system, so voters aren’t able to throw their support into other parties that would have a reasonable chance to prevail in elections. In the UK, as in much of Europe, these other parties have long played a role as coalition partners when neither major party manages to win outright. But recent polls show a large and growing dissatisfaction by Americans with both of our major parties. Around 45 percent of all US voters now identify as independent, according to Gallup News. That’s the highest percentage since Gallup started gathering this data in 1988.

Defenders of this bygone relic of a system may look around them and wonder why anyone should care. Hey, we just got another respectable jobs report this morning from the BLS, with nonfarm payroll gains of 114,000 and a still-modest 4.3 percent unemployment rate. The economy is growing, companies are making scads of money and the stock market seems happy to clamber up whatever wall of worry is put in front of it. All true. But the economy still depends on people, and it depends on a stable political framework in which these people can operate. That framework increasingly appears to be under threat. Policymakers would do well to pay attention to what is happening in Hackey, and Edinburgh, and Cardiff, and figure out how to solve some of the things that are manifestly on the minds of the citizens they serve.

MV Weekly Market Flash: The Vibes Versus Reality Gap

In the wonderful world of economic analysis we have hard data and soft data. These two things have been at odds with each other for some time, keeping those who try to supply insights and explanations about the data, ourselves included, asking why. We will try to come up with some answers as we delve into this topic today.

Let’s establish some basic definitions. By hard data we mean the numbers associated with macroeconomic performance metrics, the big three of which are arguably growth (GDP), prices for goods and services (inflation), and the availability of jobs (payrolls and the unemployment rate). Soft data, on the other hand, refers to surveys of sentiment and expectations among identifiable cohorts in the economy such as households, small businesses or multinational executives.

You could say that it’s a question of what they feel (soft data) versus what they do (hard data). Let’s look at one recent data point that has raised some eyebrows among those who follow these things. Here is the University of Michigan consumer sentiment index, with data gathered from households across the country going all the way back to 1960.

The Vibecession in Living Color

The most recent reading for the Michigan sentiment index, reflecting surveys conducted in March, has household vibes at their lowest level ever. Ever, as in lower than the 2020 pandemic. Lower than the great financial crisis of 2008. Lower than the stagflation of 1979 that led to 20 percent interest on car loans. You get the picture – lowest level in the past 66 years. When you hear financial pundit types talking about the so-called vibecession, this is what they are talking about. Now, to be clear, not every sentiment survey is quite as down-in-the-mouth as the Michigan one. According to the Conference Board’s Consumer Confidence Index, sentiment is currently about as bad as it was during the 2020 pandemic, but better than the dark days of 2008. That still gives one pause, though, given the general absence of a pandemic today.

Meanwhile in Hard Data Land

So, far though, the negative vibes are not showing up all that much in the macro hard data reports. Yesterday we got the first quarter GDP numbers, showing growth at a modest but still positive two percent (annualized) for the quarter. Consumer spending, which makes up close to 70 percent of total GDP, grew at 1.6 percent, a bit better than expected. Last week’s retail sales numbers for March also beat expectations, with headline sales up a healthy 1.7 percent. As far as jobs and inflation are concerned, they are not great and are moving in the wrong direction (unemployment and inflation both trending higher, which makes the Fed’s job in managing monetary policy very complicated). But a 3.3 percent consumer price index (CPI) and 4.3 percent unemployment rate are far, far from the most dire figures in either category. Worthy of a vibe-cooling, maybe, but not a vibecession.

There may be a simple explanation, though. Poring through levels of detail in consumer activity provides ample evidence of what economists are calling the K-shaped economy, with the bulk of spending being done by the wealthiest segment of society. To be specific: at present, according to many sources, about half of all consumer spending is coming from the top ten percent of consumers by income level.

Now, presumably when representatives of that top ten percent show up in the soft data consumer surveys, they are likely to be pretty happy with the state of things (at least as pertaining to their own material well-being). But the other 90 percent of households also feature in the surveys, and that’s where the hard-soft gap is likely to be situated. Simply put, their dissatisfaction as reflected in the Michigan survey and its ilk is more than compensated for in the hard numbers by the fact that the bulk of consumer spending is coming from elsewhere. To use a stock market analogy, you could say that the market capitalization of that top ten percent income bracket runs to half of the total market.

There may be more to it than this, and we will leave aside for now the thornier question of how sustainable this K-shaped arrangement is. But in trying to figure out what exactly is going on in this strange moment in which we are living, one has to pay attention to the hard and soft data alike.

MV Weekly Market Flash: The Jobs Market Is Not OK

The monthly jobs report from the Bureau of Labor Statistics will come out in two weeks from today. Do you want to hazard a guess as to the number of nonfarm payroll (NFP) gains reported for the month of April? Good luck with that – see below.

In the past fifteen months we have had nine months of payroll gains and six months of payroll losses, according to the BLS data. And this chart doesn’t reflect an even more bizarre facet of the BLS report, in which initial estimates are subject to sweeping revisions. Case in point: the initial report for February 2026 had nonfarm payrolls declining by 92,000. A few weeks later, that number was revised to payroll losses totaling 133,000. Who knows what that March NFP figure of 178,000 gains will look like when the BLS gives us a revision in its next release on May 8?

Below the Headlines

All the payrolls volatility notwithstanding, the headline numbers themselves are not flashing five-alarm warnings. The unemployment rate, which has bounced around between 4.0 and 4.5 percent since the beginning of last year, is nowhere close to the levels normally associated with economic downturns (though that can change quickly when exogenous factors impact prior assumptions about growth trends). At least one industry sector – healthcare – is a reliable enough job creation machine to offset steadier losses in other sectors like manufacturing and transportation services.

Below the headlines, though, there are plenty of indications that things are moving in the wrong direction. Fed chair Jay Powell is of the opinion that net job creation is effectively zero, which does not look too different from that chart above showing nearly offsetting NFP gains and losses from month to month. The situation for entry level jobs is even worse. The unemployment rate for recent college graduates (age 22-27) is around 5.6 percent, higher than the overall figure of 4.3 percent and well above the 3.1 percent level for all college graduates. Anecdotal evidence from young job seekers paints a hellish picture of thousands of resumes and cover letter sent into the void of employment search platforms, never to be heard from again. Graduate degrees in areas once thought to be sure-fire recipes for successful careers are not the golden ticket that was supposed to be worth that $100,000-plus investment in one’s education.

The Specter of AI

Looming over all the present uncertainty in the labor market is the specter of artificial intelligence. Don’t take it from us – listen to what the experts in the field themselves have to say. Dario Amodei, the CEO of Anthropic, opined recently that roughly 50 percent of entry-level white collar jobs are at risk of disappearing within a one to five year time frame, potentially creating an unemployment spike as high as 20 percent. The most exposed industries, according to Amodei, are those very ones that attract the brightest and most ambitious cohort of young people – finance, consulting, law and tech.

OpenAI, Anthropic’s peer and rival in the AI space, projects that 18 percent of all jobs will soon be automated with AI capabilities. A recent CNBC study found that AI-related layoffs totaled 55,000 in 2025. Every day we see evidence of major layoffs at tech firms – this week it was Meta (10 percent reduction to “offset” spend on AI) and Microsoft (voluntary redundancy of 7 percent) in the headlines.

Of course, for every AI Cassandra warning of the crisis ahead there is a Pollyanna pointing to the long history of doomsaying at the dawn of new technologies that proves overblown. This time, though, there may be more reason to pay attention to the Cassandras than to blithely assume that new doors will open for each one shut by the incursion of AI. The technology is growing and spreading and becoming more sophisticated at a mind-blowing rate. Not just here at home, either. China’s DeepSeek platform, which caused a major freak-out in the AI space early last year when it debuted, appears to be closing in on the capabilities of the leading US models. So there is a geopolitical element overlaid on what could be one of the biggest macroeconomic shake-ups ever experienced in our country. Regulators, policymakers and business leaders need to be ready to take up the challenge. As do the rest of us.

MV Weekly Market Flash: The Alfred E Neuman Market Returns

On Wednesday this week the S&P 500 stock index closed above 7,000 for the first time ever, and thus gave traders the thrill of two big things on the same day: a nice round number (oh, how we love crossing the round number thresholds), and a record close to boot! So the stock market has clawed back all its losses since the onset of the Middle East war, and then some. Is this the dawn of another one of those magic carpet rides the market takes us on from time to time, or is there potentially cause for a pause?

Neither we nor anyone else can answer that last question with any certainty, of course. But take note of the following: Wednesday was also the day when a company called Allbirds, which makes a line of footwear seemingly popular with the inhabitants of Silicon Valley, for reasons not entirely clear to us, announced out of nowhere that it was pivoting (a timeless expression of Valleyspeak) to become an AI compute infrastructure company. Yep, from shoes to AI compute in one easy press release. Shares in the company rose 580 percent after the announcement (no, that is not a typo). Make of that what you will. When these types of things happen, the image that comes to our mind is that grinning visage of the 1970s, Alfred E. Neuman, on the cover of Mad Magazine with the iconic tag line “what, me worry?” Indeed.

Meanwhile in the Actual World

Do you know what prices have not gone back to their prewar levels? Oil prices, that’s what, and they seem to have settled into a range around $95, plus or minus $5 or so, per barrel of Brent crude oil.

The question of when oil prices will come off their elevated levels probably will have a lot to do with whether the stock market continues on its merry way upwards or starts to cool off. Earlier this week the IMF came out with a fairly downbeat assessment of the war’s potential impact on global economic growth, painting several scenarios of increasing harm depending on how long energy prices remain stuck at current levels (or higher). In the best case, which assumes that the current various ceasefires hold and activity in the Strait of Hormuz returns to something resembling normality by early summer, global growth will fall to 3.1 percent from 3.4 percent last year – a gradually slowing trend. If energy disruptions last through the end of the year, though, the situation gets a lot more dire and the possibility of a global recession goes up, according to the agency’s analysis presented as its annual spring meetings in Washington got underway.

The stock market seems to have digested the best case scenario with no qualms. But looking ahead to those crucial summer months, oil traders are proceeding with more caution. According to current Brent crude futures prices posted by CME Group (the Chicago Mercantile Exchange), August 2026 futures are fetching around $88 per barrel, and that only drops to $82 per barrel for the December 2026 contract. Those prewar prices, fluctuating between $60 and $70 per barrel during the first two months of this year, seem a long way from being seen again.

Complacency versus Caution

Whether the market is being too complacent at present is something we only will learn over the next couple months as more data come in, particularly about jobs and inflation, both of which have been trending in the wrong direction since well before the war began at the end of February. On the caution side of the equation, we are likely to see an abundance of it from the Fed until they have a better understanding of how much the inflationary impact of the war will be structural as opposed to transitory (and don’t expect any of the governors or regional bank heads to actually say the word transitory, regardless). The labor market is similarly perplexing, with Fed chair Powell having noted on a number of occasions recently that, in his view, there is roughly zero net job creation growth happening now. It might be just as perplexing to the number crunchers at the Bureau of Labor Statistics itself, given the massive revisions that seem to be coming out every month in regard to the previously published estimates of nonfarm payroll growth.

On the other hand, there has been quite a bit of upbeat commentary from bank executives this week as the major US financial institutions report Q1 financial results and offer their views on the rest of the year. Consumer spending is ticking along and, despite high levels of consumer debt, defaults and delinquencies are more or less in line with expectations. As long as consumers keep spending and AI companies keep throwing money at their infrastructure build-out, overall growth should remain positive.

Which brings us back to that earlier sidebar about Allbirds. Watch this space, because a shoe company becoming an AI infrastructure player seems to be on par with that old parlor trick of 26-odd years ago – slapping a “dot-com” at the end of your company name and watching the share price rocket into the stratosphere. We’ve seen this rodeo before.

MV Weekly Market Flash: The Importance of the Up Days

Patience and discipline. This is the mantra we have been encouraging our clients to embrace from day one. The past several weeks has constituted one of those times when following that mantra is exceptionally important. It is also exceptionally hard, because it requires control over our very powerful lizard brain impulses of fear and greed.

An Anthology of Disruption

Because it is hard to practice the art of patience and discipline when markets go pear-shaped, we pay very close attention to the facts around disruptive events. Specifically, we have documented every drawdown in the S&P 500 of five percent or more going all the way back to January of 1929. That’s 96 years’ worth of data. We are interested, not only in the magnitude of the drawdown, but what happens afterwards. One of the most common features of the post-trough recovery period is one or more days of very large gains shortly after the low point. This past week serves as a useful example of this tendency, which we show in the chart below.

The S&P 500 reached its last record high on January 27. From there it declined by 9.1 percent to reach a low – thus far – on March 30. As you can see in the chart, much of the market’s recovery – a total of 7.6 percent from the March 30 low to the April 9 close – happened on two big up days: a gain of 2.9 percent on March 31 and one of 2.5 percent on April 8. Anyone who got out of the market sometime between January 27 and March 30 (probably closer to the latter, given how much of the drawdown has been driven by concerns over the war in the Middle East) and is still out has missed out on those up days. In the long run they matter – a lot.

Lessons from Liberation Day

Here is another specific example of why these up days matter so much. A year ago we experienced that stomach-churning event known as “Liberation Day,” when that preposterous chart showing how much the penguins on McDonald Island were going to have to pay the US government sent the market into a tailspin. That happened on April 2, 2025. Lizard brains went right to work, cranking up the fear factor and bailing out of the market. A week later, on April 9, Trump backed away from the tariffs and the S&P 500 jumped by 9.5 percent. In one day.

Here’s what that means for the longer term. The S&P 500 gained 37.4 percent from the post-Liberation Day low (on April 8) to the end of 2025. Now, let’s assume that Investor X got totally out of the market sometime between April 2 and April 8, and waited for a month before deciding that it was safe to come back in (say, for argument’s sake, on May 2). That investor’s gain from May 2 to December 31 would have bene just 20.4 percent. Not bad, of course, but still well below the 37.4 percent enjoyed by Investor Y, whose mastery of the patience and discipline mantra kept things on even keel during the chaos.

Ignorance Can Be Bliss

Of course, nobody has any idea ahead of time when these trough and recovery events are going to happen. That’s why we keep records of them – so that we can understand patterns and at least have a probabilistic argument to make for why it is better to stay invested through the rough patches. Every time the market falls by five percent or more, followed by a recovery of at least five percent, we record the drawdown-recovery as a discrete event. There have been 315 such “events” since the beginning of 1929. Over that same period there have been just 15 bear markets, defined by a structural downturn with a peak-trough decline of 20 percent or more. That is a perspective worth keeping in mind.

And even with the bear markets, staying disciplined is the better strategy. The second-worst market of this 96 year span occurred within the living memory of most of us – the global financial crisis of 2008 when the S&P 500 tumbled 56.8 percent from peak to trough. The recovery wasn’t pretty, but it happened. And within the first month after the March 6, 2009 trough, the S&P 500 registered one-day gains of two percent or more on seven occasions. Investors who got out during the mayhem paid the price for missing out on those up days.

Generally speaking, we are not fans of ignorance. But in the absence of a crystal ball to tell us when the market’s twists and turns are going to happen, it might not be the worst idea in the world to ignore the urge to time portfolio decisions around the imagined effects of market disruptions.

MV Financial

Meet Our Team

Smart Strategies.

Investment Advisor Company