Meet Our Team
MV Weekly Market Flash: The Oil Price Surge That Wasn’t
MV Weekly Market Flash: Powell Giveth, Jobs Taketh Away
MV Weekly Market Flash: And Just Like That, Bonds Are Cool Again
MV Weekly Market Flash: FTX and the Blessings of Non-contagion
MV Weekly Market Flash: Has the Santa Claus Rally Come Early?
MV Weekly Market Flash: The Strategic Case Against Emerging Markets
MV Weekly Market Flash: Things That Go Bump In the Night
MV Weekly Market Flash: Markets and Politics
MV Weekly Market Flash: Here Come the Earnings
MV Weekly Market Flash: Recessionomics

MV Weekly Market Flash: The Oil Price Surge That Wasn’t

Read More From MV

It’s been one of the go-to conversation starters of the year – how about those gas prices huh? Prices are higher for all manner of goods and services, but there is a special place in the heart of our petrol-besotted nation for those flashing red signs at the local Shell or Sunoco station, telling us exactly, to a penny, what the price of a gallon of the stuff is today versus what it was a day, a week or a month ago. So, here’s a good conversation starter for today: the average price nationwide for a gallon of regular gas...

Read More

MV Weekly Market Flash: Powell Giveth, Jobs Taketh Away

Read More From MV

It’s always a bit of a risk when our Friday morning commentary makes reference to what is happening in the market on the very same day that we write and publish. As of now US equity markets are down on the day from the stronger-than-expected jobs market report that came out earlier this morning – hence the “jobs taketh away” portion of the headline. That dynamic could, of course, change between now and the end of the day. But whatever the one-day effect on the S&P 500 winds up being, the jobs report is worth talking about in conjunction with...

Read More

MV Weekly Market Flash: And Just Like That, Bonds Are Cool Again

Read More From MV

We are heading into that final, frenetic stretch of the year. Tomorrow most of us will put aside the travails and tribulations of markets and the economy and turn our attention to the culinary delights and company of loved ones at the Thanksgiving table. Then comes Black Friday and the high-octane sport of holiday shopping. As the year races to a close, the financial industry will furiously churn out its annual tsunami of predictions for how markets will perform in 2023, most of which will likely lose their predictive value by, oh, March of next year. However, there is one...

Read More

MV Weekly Market Flash: FTX and the Blessings of Non-contagion

Read More From MV

Over the past few years we have heard a great deal about the supposed advantages of cryptocurrencies as an asset class. As all those varieties of pixelated coins inched ever closer from obscure back alleys to the wide boulevards of mainstream finance, the phrase “digital gold” was often invoked by cryptoworld’s growing legions of Silicon Valley evangelists and their A-list celebrity shills (Digital Gold, by the way, is also the name of an excellent book by Nathaniel Popper that traces the rise of bitcoin and the blockchain technology, written some time before the speculative mania took the jump into warp...

Read More

MV Weekly Market Flash: Has the Santa Claus Rally Come Early?

Read More From MV

Did you ever wonder what it takes to send the Nasdaq Composite index higher by 7.4 percent in a single day? Here’s what it takes: a single data point showing that the core Consumer Price Index (i.e. the CPI excluding the volatile categories of food and energy items) rose by 0.27 percent from September to October. That’s it. Here’s the chart to put this momentous market mover in context. As the chart shows, the September-October month-to-month move wasn’t even the biggest decline on record; the index fell even further from June to July. It was the expectations that mattered; economists...

Read More

MV Weekly Market Flash: The Strategic Case Against Emerging Markets

Read More From MV

It has not been much of a year for thinking about different ways to extend portfolio exposure into riskier asset classes. Inflation, geopolitical unrest, dysfunctional supply chains and all the other weekly wet-blanket topics have kept the focus of portfolio managers on protecting the downside. But in this business it is always wise to look ahead, because what goes down will sooner or later go back up again. In that spirit, we turn the spotlight this week to the asset class of emerging markets equities. A Bit of A Misnomer Let’s start with the simple fact of what you actually...

Read More

MV Weekly Market Flash: Things That Go Bump In the Night

Read More From MV

It’s the Friday before Halloween, so it seems like a good time for a quick tale of some of the scarier moments in financial markets over the past several decades. Here’s another reason why the present moment is a good time for this discussion: the relentless recent pace of strong consumer demand is starting to show signs of flagging, giving strength to the argument that a recession is likely to take place sometime in the first half of 2023 (a point of view with which we agree). Could market conditions get a whole lot worse than they already are? The...

Read More

MV Weekly Market Flash: Markets and Politics

Read More From MV

Do politics matter for markets? We generally have a standard and perhaps somewhat annoying answer to that question, which is “typically no, but sometimes yes.” Short-term market movements normally react to political developments only when those developments pertain directly to changes in interest rate policy or tax policy, since those are two variables that, when changed, have an immediate effect on cash flow valuation models. For the most part, our experience is that political events which may seem huge in Washington or Brussels or London resonate weakly, if at all, in financial markets. But “for the most part” is not...

Read More

MV Weekly Market Flash: Here Come the Earnings

Read More From MV

Another month, another inflation report running hot. The Consumer Price Index report for September came out yesterday, topping economists’ expectations for yet another month despite a welcome decline in energy prices. Food, shelter, medical services, new vehicles and transportation services all remain at elevated levels, leaving the market with a near-one hundred percent consensus that the Fed will once again raise rates by 0.75 percent when the Federal Open Market Committee meets next on November 2nd. By the time that meeting takes place, we will have some initial intelligence on how companies are coping with higher inflation in terms of...

Read More

MV Weekly Market Flash: Recessionomics

Read More From MV

It may seem odd to be talking about recessions when the latest jobs report, out just this morning, shows the unemployment rate back to the levels of 3.5 percent – a level which, along with those of July 2022 and February 2020, represents the lowest percentage of jobless in our country since 1969. Ultra-low unemployment, along with still-strong consumer spending patterns, normally does not signify an impending tip into negative growth. But the robust job numbers do mean that the Fed will keep raising interest rates to bring down inflation, and Fed chair Jay Powell himself has said this will...

Read More
MV Weekly Market Flash: The Oil Price Surge That Wasn’t

It’s been one of the go-to conversation starters of the year – how about those gas prices huh? Prices are higher for all manner of goods and services, but there is a special place in the heart of our petrol-besotted nation for those flashing red signs at the local Shell or Sunoco station, telling us exactly, to a penny, what the price of a gallon of the stuff is today versus what it was a day, a week or a month ago.

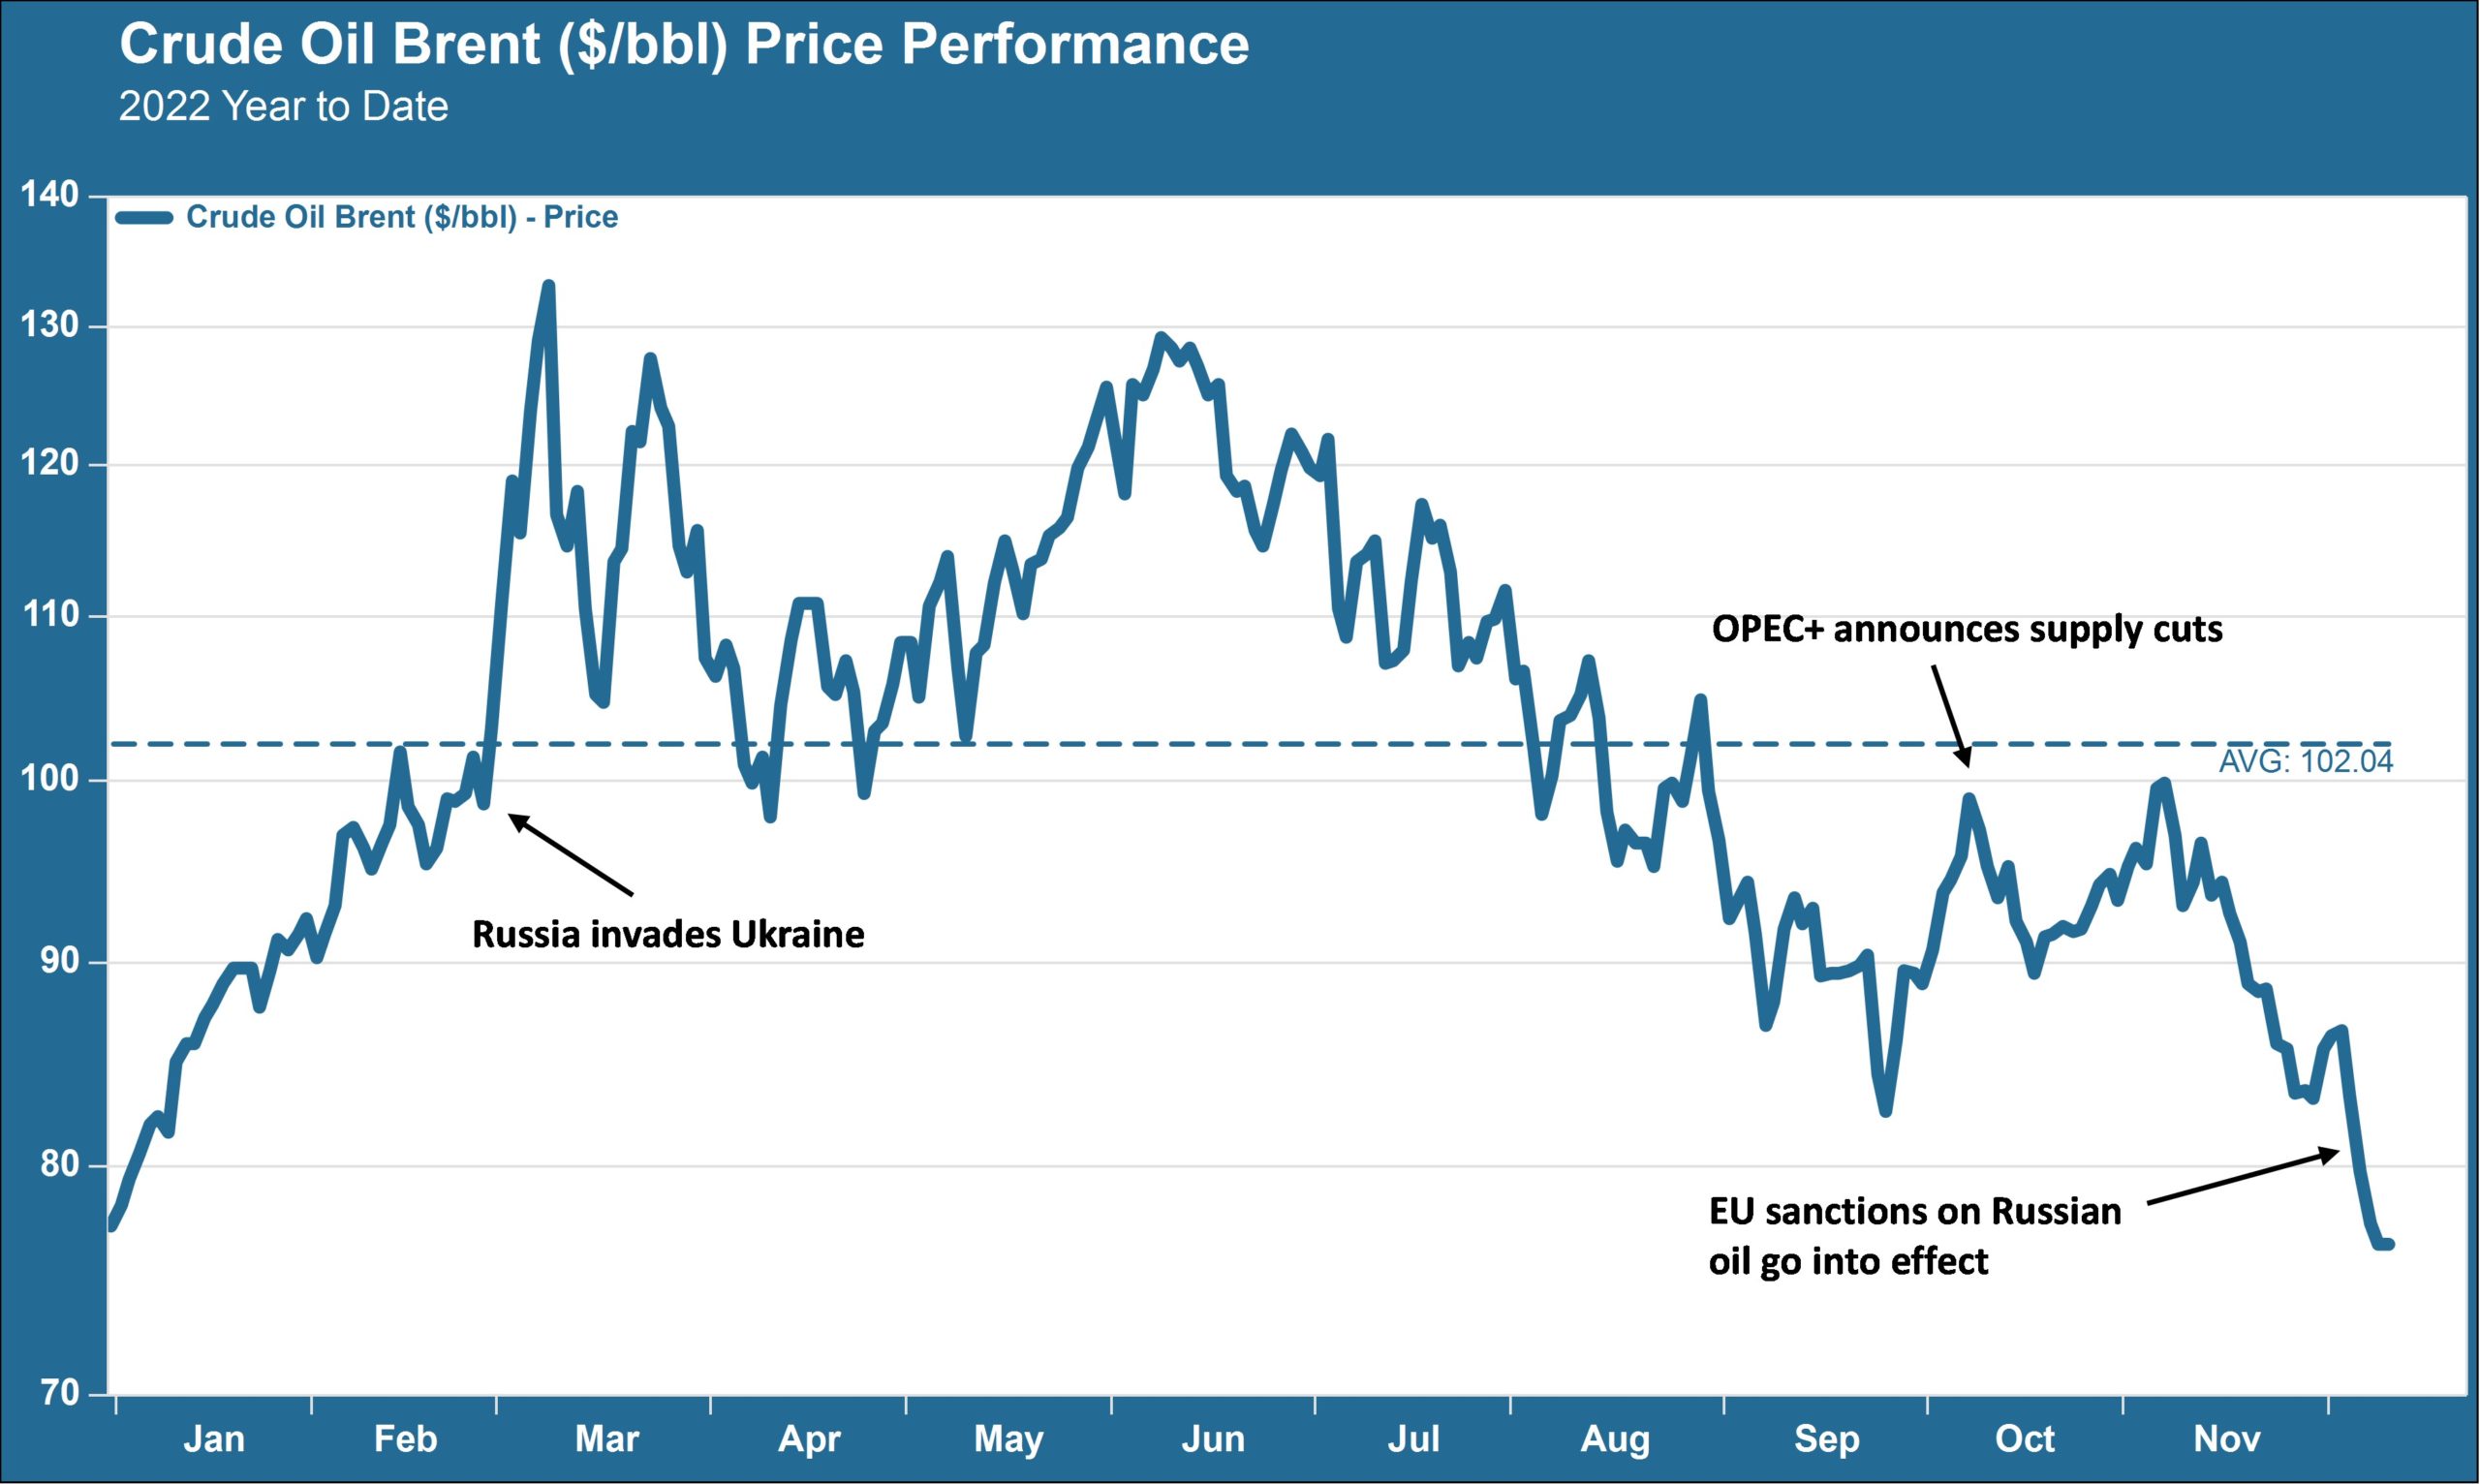
So, here’s a good conversation starter for today: the average price nationwide for a gallon of regular gas today is $3.29. On January 3, the first workday of 2022, the average nationwide price was…yep, $3.29. At the end of a year in which gas prices loomed large over monthly household budgets and struck fear into the hearts of politicians running for office, we are basically right back where we started from. In fact, the spot price for a barrel of Brent crude oil, a market benchmark, is actually down for the year to date.

Supply Surprises

Oil’s downward trend over the past two months is one of more counterintuitive developments we have seen this year. On October 5, OPEC+ nations agreed to a new round of production cuts in the amount of 2 million barrels per day. That was a significant enough supply cut to draw sharp criticism from the Biden White House, accusing the cartel of shortsighted profit-seeking and even interfering with the runup to the US midterm elections. In fact, oil prices fell in the immediate wake of the OPEC+ decision, with Brent crude dropping about $10/bbl before briefly resuming an upward trend (see above chart).

This week saw another potential landmine that many observers thought would send oil prices higher. On Monday the European Union’s sanctions prohibiting entry of seaborne Russian oil into European ports went into effect, along with a price cap, supported by both the EU and the G7, of $60 on any Russian oil sent by tanker anywhere in the world. These punitive measures could have had the effect of Russia sharply curtailing its supply; the country has claimed it will refuse to deal with any buyer who uses the price cap. Instead, the oil has flowed largely unimpeded, at least so far. Asia’s principal buyers of China and India already pay less than $60, effectively, for the oil they negotiate from Russian supply sources. In fact, the $60 price cap was designed in such a way to produce precisely this outcome, while avoiding dramatic supply cuts (it remains to be seen whether that will still be the case if world oil prices shoot back up to $100 and buyers attempt to hold Russia to the $60 cap).

Another positive factor on the supply side has been increased production here in the US. Domestic production plummeted immediately after the economy shut down in March 2020, and producers have been very slow to turn the taps back on. But the number of active US oil rigs is now back to where it was right before the bottom fell out: today’s active rig count of 627 is roughly comparable to the 624 rigs operating on March 27, 2020 according to data produced by Baker Hughes (cited in an article by Catherine Rampell in today’s Washington Post).

Demand Doldrums

On the flip side, demand trends are also helping to put downward pressure on oil prices. China, the world’s second-largest oil consumer after the US, is set to use less oil in 2022 than it did in 2021 according to the International Energy Association. Persistent lockdowns from China’s zero-Covid obsession have had a material impact on demand. While those restrictions appear to be loosening, it may be a very bumpy road for China as it tries to reopen – Covid cases there are surging now, natural immunity levels are weak and China’s domestically-produced vaccines are not up to the task of beating back the many new faces of the omicron strain.

Elsewhere in the world the economic outlook is turning down; the IMF and World Bank both issued new warnings today about growth prospects for next year. There is by no means any certainty that the US is headed for recession next year, and we have noted in several recent commentaries the ongoing conflicting signals from the labor market, consumer spending and elsewhere. But the Treasury yield curve is currently inverted more steeply than at any time since 1981, suggesting that the bond market is quite confident about an impending downturn (though risk spreads, which we would expect to widen appreciably ahead of a recession, have remained relatively tight). US oil demand for this time of year is as low as it has ever been in the past 20 years.

All of this could change, of course. If China manages to stay on course with its reopening that will likely provide some upward momentum for oil prices. Russia still is a wild card despite the relatively muted first few days of the new sanctions. And if the US does manage to achieve a soft landing with the Fed’s monetary tightening – which would be good news on many fronts – we would expect oil demand to turn up here as well. For now, though, you can probably expect fewer of those “how ‘bout them gas prices!” conversations at the water cooler, and a return to the usual observations about weird weather, college football playoffs (or the World Cup, take your pick!) and the traffic jams on the Beltway.

MV Weekly Market Flash: Powell Giveth, Jobs Taketh Away

It’s always a bit of a risk when our Friday morning commentary makes reference to what is happening in the market on the very same day that we write and publish. As of now US equity markets are down on the day from the stronger-than-expected jobs market report that came out earlier this morning – hence the “jobs taketh away” portion of the headline. That dynamic could, of course, change between now and the end of the day. But whatever the one-day effect on the S&P 500 winds up being, the jobs report is worth talking about in conjunction with that other big market driver this week, the one that did “giveth.”

That, of course, was Fed chair Powell’s speech at the Brookings Institute on Wednesday. The speech didn’t actually contain anything Powell hasn’t said before, but it did omit any pointed comments about financial conditions being “too easy.” That omission was enough to power stocks ahead by mid-single digits by the end of the day. But the question persists: are financial conditions too easy? Is a persistently strong labor market a sign that conditions are still too supportive to meaningfully suppress inflation? Or does it suggest that the Fed still has enough space to actually pull off that much hoped for soft landing?

The Jobs Conundrum

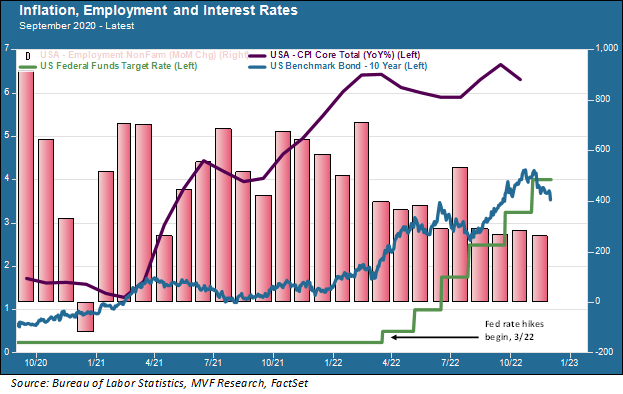
The jobs market has been the joker in the deck throughout the Fed’s campaign to slow down demand enough to bring inflation down. The chart below shows the performance of the jobs market before and during the monetary tightening period. There’s a lot of information in this chart, and we will go through it all in detail below.

Since the Fed started raising interest rates in March of this year, the average monthly growth in payrolls (the “Non-Farm Employment” mauve columns in the above chart) has amounted to 363,000 new jobs. In the past four months the monthly gain in payrolls has not fallen below 260,000. Compare that to the average number of monthly payroll gains from January 2010 to February 2020 – i.e. the long economic cycle leading up to the pandemic: 184,630. In other words – and this is important – the economy is still creating jobs on a monthly basis at a higher rate than the average throughout the longest economic growth cycle on record. This has happened even with the steepest program of interest rate hikes the Fed has engineered since the early 1980s.

One Month Tight, Ten Years Easy

That brings us to the other notable oddity on the above chart: the relationship between the Fed funds rate (the green line) and the 10-year nominal Treasury yield). Intermediate and long-term bond yields have come down considerably in recent weeks, as we covered in more detail in last week’s commentary. The Fed has signaled that the Fed funds rate is likely to wind up somewhere around five percent or even higher, depending on what it takes to bring inflation down. Today the 10-year yield sits at 3.6 percent. Does that make sense? This is a very important question for anyone with portfolio exposure to…well, just about anything. The 10-year Treasury acts as the world’s default risk-free rate, the building block upon which discount rates are built that translate expected future cash flows into present day values. A 10-year Treasury yield of 3.6 percent is an easier world for any rate-sensitive asset than a 10-year yield somewhere north of five percent. Quite a lot of portfolio money around the world is at stake in considering whether today’s intermediate and long-term rates are too easy (a characterization, which, again, Powell took a pass on during his Wednesday speech) or not.

These are not easy questions and they do not produce easy answers. There are structural factors at play that go at least some way in explaining the current labor market strangeness. It may well be that other macro data points like consumer expenditures, retail sales and household debt levels provide more useful guideposts toward an economic downturn than the jobs market. We will have more data on these items in the next couple of months. Ultimately what matters, of course, is seeing that dark-purple inflation line in the above chart come down considerably from where it is today. The Fed is not going to back off its program until it sees clear evidence of that happening. By early next year we will likely see what that means for how much more financial conditions need to change.

MV Weekly Market Flash: And Just Like That, Bonds Are Cool Again

We are heading into that final, frenetic stretch of the year. Tomorrow most of us will put aside the travails and tribulations of markets and the economy and turn our attention to the culinary delights and company of loved ones at the Thanksgiving table. Then comes Black Friday and the high-octane sport of holiday shopping. As the year races to a close, the financial industry will furiously churn out its annual tsunami of predictions for how markets will perform in 2023, most of which will likely lose their predictive value by, oh, March of next year.

However, there is one thing you are likely to hear a lot of in the coming weeks that we think does carry merit: much of the big thinking about portfolio composition in the year ahead is going to focus on fixed income. No longer just the quiet quadrant where you park “safety money,” bonds are now offering the kind of potential value not seen since long before phrases like “quantitative easing” and ZIRP (zero interest rate policy) entered the financial lexicon. At the same time, the shape of maturities and yields in the Treasury market is signaling danger ahead. Making sense of the opportunities and attendant risks in the bond market is a clear and present priority.

What a Difference a Year Makes

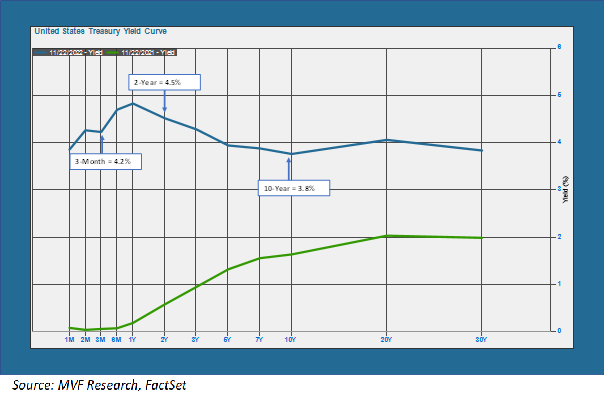
The Treasury yield curve, shown in the chart below, neatly summarizes the opportunities and the risks alike.

Let’s start with the opportunities. A year ago, every Treasury maturity up to one year was at or very close to zero (the green trendline in the chart). Today, an investment in a 3-month T-bill gets you a 4.2 percent yield, while you can park funds in a 2-year Treasury note for an even better 4.5 percent coupon. Now that’s a nominal yield, of course, and inflation is still running north of mid-single digits. But if you buy into those “dot-plot” prognostications of the Federal Open Market Committee which have inflation back down to 2 percent by 2025 (2.3 percent in 2024 according to the most recent Summary Economic Projections from the FOMC meeting back in September) then maybe locking in that 3.8 percent yield on the 10-year note looks attractive. There are alternative ways to obtain value, in other words, for quality-seeking portfolios which have been yield-starved for a very long time.

Curvy Weirdness

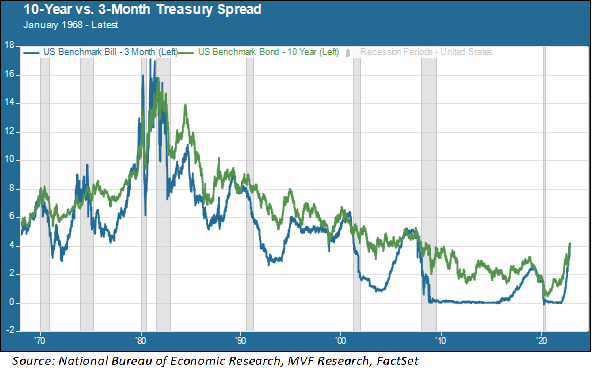
That same yield curve shows the potential risks ahead. As you can see, the curve is inverted all the way from the shortest maturity (3.85 percent for the 1-month bill) to the longest (3.83 percent for the 30-year bond). That rings alarm bells, because an inverted yield curve has historically been arguably the most reliable indicator of an approaching recession. The chart below plots the 3-month T-bill against the 10-year note going back to 1968, showing that ahead of every subsequent recession (eight total) the short-term yield moved up and inverted against the 10-year yield.

The current consensus among economists is that there is about a 65 percent chance for a recession sometime in the first half of 2023 (it’s also fair to trot out the old saw that economists have predicted ten of the last eight recessions, nevertheless here we are). The yield curve says we should expect one sooner or later (the predictive power of the curve inversion does not extend to any kind of precision in the timing, it should be noted). So what could that mean for the kind of assets you do and do not want to put into your fixed income portfolio in the year ahead?

One of the key assumptions associated with a near-term recession is that risk spreads would widen from where they are today. Currently the spread between intermediate Treasuries and other asset classes like lower-quality investment grade bonds (e.g. with BBB/Baa credit ratings) is pretty close to its three-year average. Those spreads would likely widen ahead of a recession. Remember that when yields rise, bond prices fall, and they would thus fall faster for riskier asset classes relative to Treasuries and other higher quality assets.

Does that mean you should stay away from anything other than the highest quality assets? Not necessarily. Remember that if you invest in a bond and hold it to term, the key risk that could separate you from your expected cash flow stream is a default by the issuer. In the world of high yield bonds, particularly the lower tiers of that asset class, this is a meaningful risk during an economic downturn. However, if we have a relatively mild recession – which at this point seems to be a likelier outcome than a protracted and deeply painful event – then a diversified pool of investment-grade bonds with a mix of credit ratings from AAA to BBB can be worth taking on a bit of extra credit risk for the higher yields they offer. The average yield on Moody’s A-rated corporates is around 5.45 percent and for Baa-rated issues it is 5.91 percent. For income-seeking portfolios that is at least worth some consideration.

These and plenty of other questions will be occupying our minds in the weeks ahead. For now, though, we wish each and every one of you a very happy, healthy, restful and delicious Thanksgiving.


MV Weekly Market Flash: FTX and the Blessings of Non-contagion

Over the past few years we have heard a great deal about the supposed advantages of cryptocurrencies as an asset class. As all those varieties of pixelated coins inched ever closer from obscure back alleys to the wide boulevards of mainstream finance, the phrase “digital gold” was often invoked by cryptoworld’s growing legions of Silicon Valley evangelists and their A-list celebrity shills (Digital Gold, by the way, is also the name of an excellent book by Nathaniel Popper that traces the rise of bitcoin and the blockchain technology, written some time before the speculative mania took the jump into warp speed in 2020 – well worth reading if you want to understand the origin story).

The idea that holding bitcoin or another digital currency could perform a gold-like hedge against adverse moves in the stock market took a resounding beating when the animal spirits pushing crypto and speculative tech shares to new heights both peaked around the same time – November 2021 – and went into a tandem spiral downward. Whoops. But there is a somewhat brighter corollary to the story: it turns out that, despite the best efforts of Matt Damon and Tom Brady and the like, cryptocurrencies never actually went mainstream enough to pose a contagion risk to other asset classes. Given what has happened to one of the biggest names in the sector over the past couple weeks, that really is something to give thanks for over the stuffing and cranberry sauce this year.

SBF, the New JPM (Not)

The recent fate of crypto exchange FTX and its once-illustrious founder Sam Bankman-Fried helpfully answers one question: is it possible for $32 billion to vanish into thin air in the space of two weeks? Why, yes it is! FTX was the third-largest crypto exchange in the business, and its leader, who of course was known by the cognoscenti as SBF, was not only one of the industry’s shining stars but also a prolific fundraiser and political mover and shaker (his fall from grace was very unwelcome news to a great many politicians, mostly Democrats, in Washington). FTX attracted as major investors the likes of Sequoia, one of the oldest and most respected Silicon Valley VC firms, and Temasek, the Singapore wealth management fund. Earlier this summer, when FTX intervened to bail out a handful of failing crypto players, there was talk comparing Bankman-Fried to the legendary financier J.P. Morgan, the founder of the eponymous bank who was a one-man Committee to Save the World during the Panic of 1907.

That ended abruptly just one week ago, when a run on FTX by customers stampeding for the exit revealed that the exchange had liabilities of over $9 billion against assets of just $1 billion (and the money trail chicanery is way, way more complicated than that one simple asset-liability mismatch). It turned out that when SBF was running around trying to shore up other crypto exchanges, he was most likely doing this not out of some grand altruistic impulse but in a desperate effort to paper over his own financial black hole. In the end, he wound up looking less like J.P. Morgan and more like the Knickerbocker Trust Company, the overextended lender whose troubles started that whole Panic of 1907.

Now For the Good News

Over the past several years we have grown increasingly concerned about the aggressive attempts by its main backers to push cryptocurrencies into mainstream finance. This is not because we think the entire idea of digital currencies is worthless – far from it. The original bitcoin manifesto of Satoshi Nakamoto (who may or may not be an actual person and who may or may not be alive on the planet in the year 2022) and, even more so, the underlying blockchain technology do have some interesting aspects. The technology, in particular, can potentially perform certain financial operations in a more secure, less expensive and less intermediated manner than through traditional financial channels. And we do think that digital currencies – most likely through a mechanism operated by national central banks – will play an increasing role in the financial system in years to come.

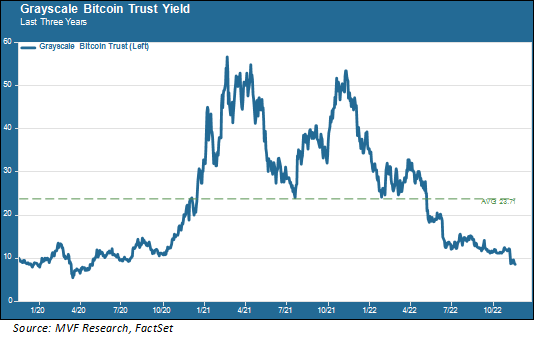
That being said, we never saw a compelling use case for bitcoin and its ilk to convince us that it was an appropriate asset class for the long-term investment portfolios under our stewardship as asset managers. Our view was increasingly challenged as more and more mainstream voices joined the chorus of crypto fandom. New vehicles emerged offering ever-easier ways to obtain exposure. Here’s one: Grayscale Bitcoin Trust, the world’s largest crypto fund with a value (still!) of $10.5 billion.

Not a great look, as they say. Now, if the 2021 crypto rally had continued into this year – who knows, the asset class could have grown enough and become systemically entwined within the balance sheets of enough major players that the fall of FTX could have created a mass contagion. Within the crypto industry the FTX debacle is being called crypto’s “Lehman moment.” When Lehman Brothers fell in 2008 it nearly brought down the entire financial system – because of all those overleveraged exposures on the balance sheets of so many major financial institutions.

But the collateral damage from FTX is limited to the likes of Grayscale – bad news for those who drank Matt Damon’s Kool-Aid about investing in crypto being a feat equivalent to climbing Mount Everest or inventing the internal combustion engine – but not much more than another head-shaking tale of greed and gullibility for the rest of us. So let’s give thanks, and please pass the cranberry sauce.

MV Weekly Market Flash: Has the Santa Claus Rally Come Early?

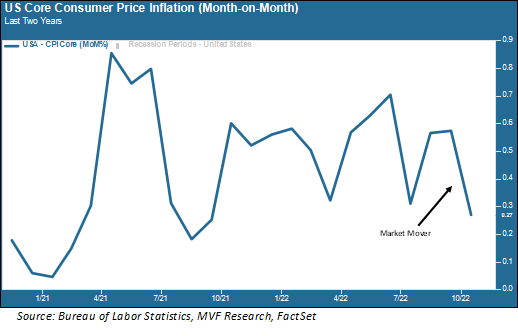
Did you ever wonder what it takes to send the Nasdaq Composite index higher by 7.4 percent in a single day? Here’s what it takes: a single data point showing that the core Consumer Price Index (i.e. the CPI excluding the volatile categories of food and energy items) rose by 0.27 percent from September to October. That’s it. Here’s the chart to put this momentous market mover in context.

As the chart shows, the September-October month-to-month move wasn’t even the biggest decline on record; the index fell even further from June to July. It was the expectations that mattered; economists expected that core inflation would rise by 0.5 percent, and it rose by less than that. Voila, and out came the animal spirits. The S&P 500, which fell to a year-to-date low of minus 25 percent in the middle of October, built the magnitude of its recovery back by nearly ten percent, and is now down just 16 percent from January. Is this sustainable?

Impeccable Timing

Nobody knows what is or is not going to happen over the remaining seven-odd weeks of 2022, but we think the ingredients could be in place for a more substantial bounce than we have seen in some of the more effervescent relief rallies of late. A big part of this view has to do with the timing. The final weeks of the year have a certain flavor in many years, a skew towards the positive. The holiday season puts the focus on retail and other consumer-facing sectors. Money managers tend to “window dress” their portfolios by loading up on whatever looks hot, so as to avoid unpleasant conversations with their clients come January. Forecasts for the year ahead are blasted from chief economists’ desks into the highways and byways of the financial media world. Most of those forecasts will wind up being egregiously wrong, but they almost always assume that prices will go up in the next twelve months. Good cheer abounds.

No News Is Good News

Of course, the “Santa Claus” rally, as the wags on Wall Street like to call it, doesn’t come every year. Unpleasant surprises can happen in late November and December just as much as any other time of the year. As we said earlier, anything can happen before the ball drops on New Year’s Eve. But we do not see much in the way of surprises ahead from the big directional stories of 2022: inflation, interest rates and corporate earnings.

On the inflation front, there is some evidence that supply chain bottlenecks are easing up: shorter wait times for cargo ships idling in ports, greater availability of critical industrial inputs and the like. This may already be showing up in the inflation numbers; another benign CPI print in December would go at least some way in supporting the view that this week’s better inflation number was not just a one-off.

Interestingly, the CPI report in December will come out a day ahead of the Fed’s last meeting of the year. The Federal Open Market Committee will again, in nearly all likelihood, announce an increase in the Fed funds target rate, though it is not clear whether they will push for another 0.75 percent hike or decide that the time is at hand to dial back the magnitude of a single event to 0.5 percent. It is unlikely that yesterday’s inflation report will by itself do anything to change minds at the FOMC, but another better-than-expected report could start to influence the thinking at the Eccles Building.

Even on the geopolitical front, where most of the news this year has been fairly grim, conditions seem relatively calm. Russia’s retreat from the strategically important city of Kherson this week could potentially open the door, if only ever so slightly, to talks aimed at ending the conflict. Ahead of the forthcoming G20 meeting in Indonesia President Biden will meet with his Chinese counterpart Xi Jinping, with a view towards easing the high level of hostility and distrust between the world’s two largest economies. And the US midterms this week, while still dragging on in the vote count to determine which party will control the House and Senate, served up nothing for markets to get antsy about.

There will be plenty of problems and challenges to address as 2023 comes into focus. For now, though, we think there is at least a reasonable case to make for more stable market conditions seeing us through to the end of the year.

Happy Veteran’s Day to all who are serving or have served our great country.

MV Weekly Market Flash: The Strategic Case Against Emerging Markets

It has not been much of a year for thinking about different ways to extend portfolio exposure into riskier asset classes. Inflation, geopolitical unrest, dysfunctional supply chains and all the other weekly wet-blanket topics have kept the focus of portfolio managers on protecting the downside. But in this business it is always wise to look ahead, because what goes down will sooner or later go back up again. In that spirit, we turn the spotlight this week to the asset class of emerging markets equities.

A Bit of A Misnomer

Let’s start with the simple fact of what you actually get when you invest in a security tracking a broad-based emerging markets index. MSCI has been at this game longer than just about anyone, and their emerging markets index is pretty much the gold standard of the asset class. What’s in that index? As of the most recent fact sheet through October 2022, a full 69 percent of the index is made up of four Asian countries: China, India, Taiwan and South Korea. The entire remainder the emerging markets world from Latin America to Eastern Europe, the Middle East, Africa and the rest of Asia is lumped into that residual 31 percent. Considering the strategic fundamentals, the MSCI EM index is essentially a bet on the future prospects of Asia’s largest economies (excluding Japan, of course, which graduated from “emerging” status many decades ago, and the financial centers of Singapore and Hong Kong).

Thirty Years Is A Long Time

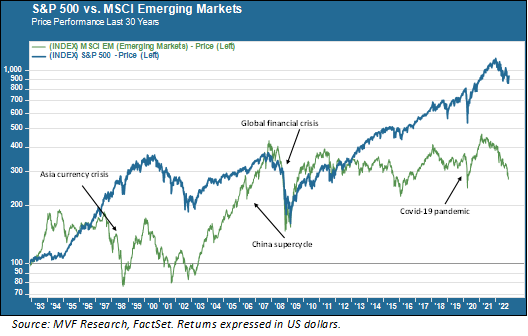
So how have things worked out for this asset class so far? Consider the thirty-year performance of the MSCI EM index versus the S&P 500. Thirty years is a long time and a lot of market cycles – and bear in mind that the entire premise of a high-risk asset class like emerging markets is that by taking on that higher level of market risk, the investor should expect the possibility for higher longer-term returns.

The top-line message of this chart is quite simple: over the past thirty years, from 1992 to today, the S&P 500 has returned more than three times as much as the emerging markets index for a US-based investor (the returns here are expressed in dollars, the home currency of a domestic investor). The corollary to the top-line message is that all that underperformance of returns came with more risk. Consider the Asia currency crisis of 1997 (highlighted on the chart). The EM index plunged and then rallied again in late 1998 – but even after the bounceback the index was below its pre-crisis high. All the while the S&P 500 was steadily surging ahead during the economic boom of the late 1990s.

In the chart you can also clearly see that there have been select periods of strong outperformance by emerging markets, and none more so than the China supercycle era of the early 2000s (also highlighted). This was the period when China surged on its way to becoming the world’s second-largest economy. Even after the global financial crisis of 2008, China, along with other Asian economies, bounced back faster than other parts of the world. But the supercycle eventually ran out of steam during the 2010s as China tried – several times and mostly without much success – to rebalance its economy away from massive state-led expenditures into infrastructure and property development and into consumer spending.

Tactical investing works if you get the timing right, but in our opinion accomplishing that is a matter of luck more than a matter of skill. And you need the favors of Lady Luck twice – not just in figuring out when to get in but, perhaps even more difficult, when to call it quits and get out.

The Almighty Dollar

The other important consideration, true for any investment outside of one’s home currency, is the strength of the dollar. A substantial part of the outperformance of domestic stocks over both emerging and developed non-US markets, particularly in the past decade, has been the dollar’s continued dominance over this period. If you invest in a foreign asset and that asset earns a ten percent return but the currency in which that asset is based falls ten percent against the dollar, then your portfolio statement at the end of that period is going to show a return of zero. Even with the historically low interest rates that prevailed up to the end of 2021, the dollar retained its strength and made it clear that, for the time being anyway, there is no viable challenger to its status as the world’s reserve currency. And that matters when it comes to portfolio choices.

So what about going forward? The world economy seems to be in a different place today than it was for much of this 30-year period, with more hostility and less of the frictionless collaboration characteristic of the peak globalization era. China, for one, is investing heavily in targeted sectors where it hopes to achieve dominance, including clean energy technologies and biosciences. India has put in some solid growth in recent years. Taiwan continues to dominate the global semiconductor industry through its blue chip heavyweight Taiwan Semiconductor Manufacturing Company, which produces around 80 percent of the world’s advanced computer chips (South Korea’s Samsung being the other gorilla in this sector).

One of our core tenets as portfolio managers is that we do not adhere rigidly to ideology. We will never invest or not invest in something because of a preconceived belief system. What we will do is evaluate the data and consider the pros and cons of alternative strategic choices. For now, as we look ahead to where we might allocate more weight to riskier asset classes, we are inclined to look elsewhere than emerging markets. That may change – but for now we think the cons outweigh the pros.

MV Weekly Market Flash: Things That Go Bump In the Night

It’s the Friday before Halloween, so it seems like a good time for a quick tale of some of the scarier moments in financial markets over the past several decades. Here’s another reason why the present moment is a good time for this discussion: the relentless recent pace of strong consumer demand is starting to show signs of flagging, giving strength to the argument that a recession is likely to take place sometime in the first half of 2023 (a point of view with which we agree). Could market conditions get a whole lot worse than they already are?

The Sound of Assets Breaking

The short answer to the above question is: sure, things could always get worse, and they could also get much better, too. But when we look more closely at those scary moments stock prices have experienced, we find that much of the dismay has less to do with economic recessions than with other things – with other latent threats that surface and exert a sudden, sharp influence on risk assets of a certain class. Consider the following chart. Here we document each instance since 1987 – the year of the fabled Black Monday crash on Wall Street – when the S&P 500 has retreated by a magnitude of ten percent or more (ten percent being the technical definition of a market correction).

Over this 35-year span of time we have witnessed twelve instances of market corrections. Only one of these twelve events, in our judgment, resulted directly from a cyclical economic recession, and that was the 1990 recession (the gray columns in the chart represent periods of recession). Yes – there were three other recessions apart from the 1990 event. But in those cases the recession itself was caused by financial breakage – the tech bubble crash in 2000, the credit and mortgage market meltdown in 2008 and the deliberate shutdown of the economy in March 2020. The stock market drawdown resulted more from the breakages than from the recession itself.

Black Monday Set the Pace

Each of these drawdowns has its own particular tale of misery, but there are some common threads. Black Monday is a great place to start. On October 19, 1987 all major US stock indexes fell by more than 20 percent in a single day. There was no recession, no geopolitical crisis, nothing to suggest that the largest single-day drop in stock market history was about to take place. But there was a nifty little financial hedging strategy going on with major institutional investors like pension funds; a thing called “portfolio insurance.” The theory was simple enough: if prices go down by more than a certain threshold, sell to cut your losses. That theory was underpinned by the fundamental axiom of boundless liquidity; i.e. for every seller there will always be a buyer.

But if enough people are selling the same thing at the same time, then the supply of buyers dries up. Prices keep going down, which triggers a vicious cycle of yet more selling. That is what happened on Black Monday, and in fact that is what happened just a couple weeks ago in the market for UK sovereign debt, as we have discussed in a couple of our recent commentaries.

The October ’87 crash was a template of sorts for a number of the breakages that would follow, including the failure of hedge fund LTCM in 1998, the rapid unraveling of Internet stocks in 2000 and, most famously, the discovery in 2008 that problems in the subprime mortgage market were just the tip of an overleveraged iceberg of interlinked credit instruments that nearly brought the entire financial system down when, in the wake of the Lehman Brothers bankruptcy, buyers all ran for the exits.

The Fed Steps In

Black Monday set another durable trend in motion: the repeated market bailouts at the hands of the Federal Reserve. The US central bank under then-chair Alan Greenspan stepped in to provide liquidity in the immediate wake of that market crash, and then he and his successors proceeded to operate from the same playbook throughout the ensuing chain of events up to and including the 2020 pandemic. That event was perhaps peak Fed: with even the US Treasury market seizing up during the worst of the March 2020 panic, the Fed pledged to essentially buy whatever assets it needed to in order to restore confidence and liquidity.

So where does that leave us today? Clearly, the key difference in the market climate of 2022 from all the other years shown in the above chart is that the Fed is not in the market providing liquidity, but is rather taking money out of the system as it tries to subdue the highest levels of consumer inflation in forty years. As we see it, the Fed’s current policy will continue at least through the end of the year until the Fed funds rate winds up somewhere north of 4.5 percent. A rate hike of 0.75 percent in November, widely expected, plus another one of 0.5 to 0.75 percent in December would bring us to that level (the upper bound of the Fed funds target rate is currently 3.25 percent).

At that point the central bank will likely slow down or even pause the monthly rate increases to assess the policy’s effects on inflation and economic growth. We would expect to see asset prices stabilize somewhat under these conditions with a more sustained upward directional trend commencing well ahead of the general economy bottoming out (note: this is an observation, not investment advice). This has been the case in basically all the recessions we have had since 1945 (the exception was the 2001 recession, in which as we noted above the market was impacted more by extraneous events than by the recession itself).

What we cannot predict, of course, is the sudden emergence of another threat that breaks the market in the manner of those previous events of the past 35 years. Nobody had “UK gilts and pension funds” on their 2022 bingo cards, yet here we are. How would the Fed react to some kind of market breakage? We don’t know for sure, but the Bank of England supplied a template with their emergency intervention in the UK gilt market. What we do know is that any such forced intervention into US asset markets would be an unwelcome distraction from finishing the job of putting high inflation to bed. More treats, and fewer tricks, is what we could use this time around.

MV Weekly Market Flash: Markets and Politics

Do politics matter for markets? We generally have a standard and perhaps somewhat annoying answer to that question, which is “typically no, but sometimes yes.” Short-term market movements normally react to political developments only when those developments pertain directly to changes in interest rate policy or tax policy, since those are two variables that, when changed, have an immediate effect on cash flow valuation models. For the most part, our experience is that political events which may seem huge in Washington or Brussels or London resonate weakly, if at all, in financial markets. But “for the most part” is not the same thing as “always,” which brings us to the events of this week.

From Walpole to Truss

Great Britain has had prime ministers for more than 300 years, starting with the eminent Sir Robert Walpole in 1721. So it was pretty impressive, and not in a good way, when Liz Truss this week became the shortest-lived PM in that entire span of three centuries, spending just 44 days in residence at 10 Downing Street before being shown the door this past Wednesday. Those were not a good 44 days for our friends across the pond. Let’s look at it from a market perspective.

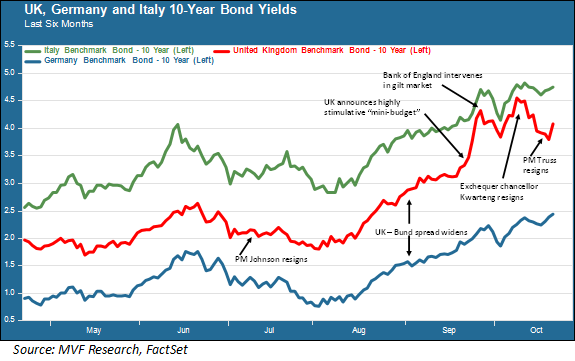
Here in this chart we show the past six months’ trend in the bond market, looking at one normally stable benchmark issue (German Bunds), one typically volatile security (Italian sovereigns), and a sovereign issue which appears to be reclassifying itself from “stable” to “not as stable,” namely UK gilts. If we go back to the period between April and July we see a fairly stable relationship between the yield trends of the UK and German bonds (the blue and red lines respectively). Italy (the green line), true to form is more volatile.

In early July former UK prime minister Boris Johnson resigned, setting off a contest within the ruling Conservative Party to select the next prime minister. We’ll come back to the question of this selection process later, because it is germane to our theme of politics and markets, and because it is happening again with the Truss resignation. For now, we can see that the immediate aftermath of the Johnson resignation itself did not do much to change the basic spread relationship between gilts and Bunds.

Starting around mid-August, though, the pattern started to change. Gilt spreads started to widen versus the Bund and in fact started to look more like Italian bonds. Interest rates were rising across the board in this period, but the rate of change (which is what matters when we’re talking about spreads) was more pronounced for UK and Italian bonds than for the German benchmark. From a political standpoint, this was the period when the likelihood of Liz Truss becoming the next prime minister came into focus. She was campaigning on a platform of “growth at all costs” which raised the specter of the policies, like massive unfunded tax cuts, that her government would indeed wind up trying to implement when they came into power in early September – at the same time that the Bank of England was trying to fight what by then had become double-digit inflation.

Not Cool, Britannia

The chart then highlights the key events that roiled the gilt market following the announcement of this planned fiscal stimulus on September 23. Gilt yields soared, then fell back when the Bank of England intervened, then rose again when the BoE put a firm exit date on its intervention, then fell again when the controversial exchequer chancellor Kwasi Kwarteng resigned, followed of course by the resignation of Truss herself this week. In early trading today they have jumped again sharply – not a good sign.

The sharp fall in gilt yields since Kwarteng resigned (which effectively took all those ill-conceived tax cuts off the table) might raise hopes that UK sovereigns will return to their conventional ways and trade with more predictability against other stable benchmarks. We do not think that is likely, and not just because of this morning’s sharp reversal. Here we get to the essence of when politics can have a more long-lasting effect on markets. Recall that Truss’s selection as prime minister was not the result of a general election in which all the voting public participated. It was a party-only contest, first decided by Conservative Members of Parliament and then by citizens who were current dues-paying Tory party members. It was estimated that less than one percent of the country actually cast a vote in the process that eventually brought Liz Truss to power.

Now that same highly selective, undemocratic process will play out again (with the added possible spectacle of former PM Johnson throwing his hat back into the ring). The leader of the opposition Labour Party, Keir Starmer, has called for a general election to decide the next government. This won’t happen, though, because the Conservative Party knows it would lose a general election were one held today. The Tories (Conservatives) are currently polling around 14 percent approval versus 53 percent for Labour.

The result of this is that come November, the UK will have had three prime ministers in the space of four months, two of whom were not the winners of any kind of a general election. That, to put it mildly, is not what is expected of an economy (or society, for that matter) as developed as the UK’s. Even Italy, which also cycles through governments at a fairly brisk pace, looks better in comparison. Britain’s next scheduled general election could be as far away as January 2025. That’s a lot of time for more chaos, and for the credibility of the country’s troubled institutions to fall further still. It’s a lesson that other developed countries with their own political problems should heed: it may not always seem like chaotic politics matter for markets, but there can be a price to pay, and in the bond market that price can be very real.

MV Weekly Market Flash: Here Come the Earnings

Another month, another inflation report running hot. The Consumer Price Index report for September came out yesterday, topping economists’ expectations for yet another month despite a welcome decline in energy prices. Food, shelter, medical services, new vehicles and transportation services all remain at elevated levels, leaving the market with a near-one hundred percent consensus that the Fed will once again raise rates by 0.75 percent when the Federal Open Market Committee meets next on November 2nd.

By the time that meeting takes place, we will have some initial intelligence on how companies are coping with higher inflation in terms of growth and profit margins. Third quarter earnings season kicks off today, and it is an important one. There is a sense in some corners of the market that earnings are the next “shoe to drop” in terms of negatively impacting stock price performance. Other corners of the market are more sanguine, arguing that expectations are already dismal and thus companies have a relatively low bar to clear to avoid undue negative surprises. For our part, we are less concerned about where the Q3 reported numbers come in relative to analysts’ expectations, and more interested in what company management teams have to say about how their expectations going forward have, or have not, changed.

The Sales – Earnings Gap

One trend is already evident in the numbers: a widening gap between top line sales growth and bottom line net earnings growth. For the third quarter, sales are projected to grow by 8.5 percent from their levels twelve months ago. That estimate is only slightly lower than the 9.9 percent consensus estimate for Q3 sales made back on June 30.

The picture looks different down at the bottom line. Net earnings per share are expected to grow by just 1.4 percent, a vastly lower number than the 9.6 percent growth that analysts had forecasted back on June 30. Think about that: when the third quarter began in July, the expectation among the analysts who follow everything about these companies at an incredibly detailed level was that sales and earning would grow by roughly the same amount. In other words, neither reduced demand from their customers nor higher input prices from their suppliers (of materials, labor and other services) would have much of an effect on overall financial performance.

That picture is very different today. If sales growth does register in the high single digits, it most likely means that companies are still able to successfully offset somewhat lower levels of unit volume by passing on higher prices to their customers. But – not by enough to offset their higher input costs (that sharply reduced EPS growth estimate), meaning that profit margins are set to get measurably worse.

When Demand Turns

If you venture out to your local Home Depot or a popular restaurant in your neighborhood (or, say, catch a flight from DC to San Francisco), you will probably be able to collect plenty of anecdotal evidence in support of the near-term continuation of strong sales growth. People are still buying things – lots of things – despite having to pay more for these things than they did a year ago. This is why those inflation numbers are so persistently high despite what is by now a six month campaign by the Fed to bring consumer prices down. Monetary tightening by the Fed only works on the demand side of the equation. The central bank can’t do anything about lockdowns in China, or the war in Ukraine, or supply chain malfunctions in Vietnam. Higher interest rates can only affect domestic demand, and so far that demand is only very slowly subsiding. Hence the low unemployment rate and relatively benign consumer confidence.

It is when the demand equation starts to turn that we are likely to see progress in lowering inflation. We are also almost sure to see weakening sales trends from the current high-single digit levels, since companies will run into much more resistance to higher prices from their customers, particularly for the many categories of highly discretionary items that fall into the category of want rather than that of must have. In fact there is already some early evidence of this: the one major category in the CPI basket of goods apart from energy to register a decline in yesterday’s CPI report was apparel – broadly speaking a more discretionary category than, say, food, shelter or medical services.

We may get a further taste of this trend with the bank reports coming out today (not yet released as of the writing of this commentary). The major banks like JPMorgan Chase, Bank of America and Citi will have plenty to say about their consumer credit portfolios, including whether they are building up more reserves ahead of anticipated losses from defaults and delinquencies. This may be a good leading indicator as to what we can expect in the next three to six months.

Meanwhile, remember what we have said in recent commentaries: what is happening now in the economy and financial markets is cyclical. That does not mean it is immune from other extraneous X-factors, like the recent turmoil in the UK gill market. But the economic aspect of this – the inflation, the job market, all of it – is cyclical. And the thing about cycles is, they pass. This one will, too.

MV Weekly Market Flash: Recessionomics

It may seem odd to be talking about recessions when the latest jobs report, out just this morning, shows the unemployment rate back to the levels of 3.5 percent – a level which, along with those of July 2022 and February 2020, represents the lowest percentage of jobless in our country since 1969. Ultra-low unemployment, along with still-strong consumer spending patterns, normally does not signify an impending tip into negative growth.

But the robust job numbers do mean that the Fed will keep raising interest rates to bring down inflation, and Fed chair Jay Powell himself has said this will not happen without some pain. Sooner or later, the labor market and consumer demand will soften. So now seems as good a time as any to dive into the data and think about what a recession could mean for portfolio performance. You are likely to hear a great deal from the usual talking heads in financial media about recessions and markets, and much of that is likely to be…misleading, to be polite. We will shortly be publishing a more in-depth research paper on the topic; you can read today’s commentary as sort of a teaser for that upcoming piece.

Recessions By The Numbers

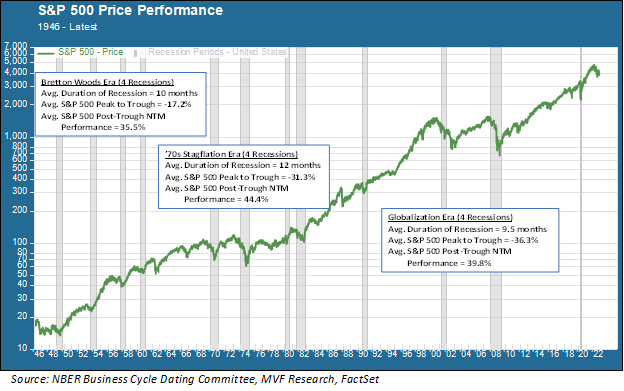
Let’s start with the big picture. In the postwar era we have experienced twelve recessions in the US. They divide rather neatly into three distinct economic eras: four in the postwar Bretton Woods era over the period 1948 to 1960; four during the long 1970s era of stagflation, and four spread very widely over the modern globalization era, from a brief downturn in 1990 to the even briefer (but much deeper) pandemic recession of 2020. The chart below gives a snapshot of this entire period.

In the above chart we provide three metrics: the average duration of the four recessions in each economic era, the peak-to-trough price performance of the S&P 500 (with the peak representing the highest price within 12 months prior to the start of the recession and the trough being the low point reached during the recessionary period), and the S&P 500 price performance for the next twelve months (NTM) following the recession trough). Let’s look briefly at each of these in turn.

Production Cycles in the Bretton Woods Era

The long macro growth period immediately following the Second World War was a unique era of economic history, characterized by managed trade, fixed exchange rates (gold convertible into US dollars at $35 per ounce) and strict restrictions on the movement of capital across borders. It lasted roughly from the end of the war in 1945 until 1971, when then-President Nixon took the dollar off the gold standard.

The domestic US economy was very different in those days to what it is today. Although the US was the world’s largest exporter of both goods and capital, most major US companies were almost exclusively focused on the growing home market, where the baby boom was in full swing and the middle class was growing in both numbers and household wealth. Business strategy was focused on fixed capital investment and long-term production cycles.

Each of the four recessions in this period was a more or less classic textbook case of investment and production capacity falling off after running hot. The cycles came more quickly than those of later times: four recessions in the twelve year period from 1948 to 1960, or roughly one every three years on average. These recessions were also fairly similar in terms of duration and also in terms of stock market performance. The deepest peak-trough drawdown was 20.7 percent, and the shallowest was 12.8 percent. The market recovery in the twelve month period following the trough was also fairly uniform.

Policy Failures in the Stagflation Era

Next up are the four recessions over the period from 1970 to 1982, otherwise known as the “long 1970s.” The only one of these four that could plausibly be termed a “cyclical” recession similar to those of the Bretton Woods era was the recession of 1970, which came after an eight-year period of go-go economic growth powered by a major tax cut in 1964 and increased government spending to support aggressive social programs at home and the Vietnam War abroad.

Growth resumed after the 1970 recession, but so did inflation. The US dollar nosedived in the wake of going off the gold standard, and then OPEC quadrupled the price of oil in 1973. The recession of ’73 was the deepest to date in the postwar period. The Fed under chair Arthur Burns vacillated between raising rates to fight inflation and lowering them to fight recession. That indecisiveness led to stagflation – slow growth, high unemployment and high inflation.

The two recessions at the end of this period – often lumped into one event called a “double-dip” recession – proceeded directly from the austere Fed policy under Paul Volcker in which the Fed funds rate went as high as 20 percent and the scarcity of credit choked off economic growth. It also set the stage for a long period of growth that would follow in the ensuing decades.

From a portfolio performance standpoint there are a few things of note in this period, the first being that it was in general a terrible era for portfolio performance. The S&P 500 was unable to permanently sustain its high water market of 1968 until the great bull market of the 1980s began in 1982. The recessionary drawdowns in this period were also much steeper than those of the Bretton Woods era: minus 31.3 percent on average with the grinding recession of 1973-75 witnessing a 48.2 percent drop. These recessions were also more directly impacted by monetary policy – first the dithering of the Burns Fed and then the tough love of the Volcker Fed – than in the previous era.

The Globalization Era: Bubbles, Bubbles Everywhere

This brings us to the modern era of globalization, which we may or may not still consider ourselves to be in (we will have an additional research paper dedicated to this topic sometime in the weeks ahead). The first recession of this era, in 1990, was plausibly the most conventional – putting on the brakes after a long economic expansion. The stock market performance during the 1990 recession was also a bit more like the old recessions of the 1950s, with a peak-trough decline of just 18.2 percent.

The other three recessions were anything but conventional. The first, in 2001, happened in the middle of another event which arguably had a much bigger impact on price performance than the recession itself: the bursting of the tech bubble that started in 2000. One of the distinctive economic characteristics of the globalization era was the laser-like focus on short-term profits and asset price performance, as opposed to the long-term fixed capital investment cycles of the 1950s and 1960s. This asset price focus took on a life of its own in the latter part of the 1990s and then burst apart like a supernova. While the recession of 2001 was relatively mild, the asset bubble dynamics exacerbated the stock market decline, which plunged a whopping 49 percent from the 2000 peak to October 2002 (well past the end of the recession in December 2001).

Then came the big one – the financial crisis of 2008. The near-implosion of the financial system itself was the main catalyst for what became the most painful recession on record since the Great Depression. There was a bubble element to this event as well, but in this case the culprit was not unrealistic stock price valuations as with the 2000 tech crash, but a whole bunch of highly leveraged, interlinked mortgage and credit instruments which all unraveled when national housing prices peaked and went into decline.

Most unique of all, though, was the pandemic recession of 2020. In the space of two short months this recession, which came about due to human actions rather than organic cyclical developments, produced the deepest decline in GDP growth and the largest number of job losses since the Depression. But as soon as it happened, it was over.

What Happens In 2023?

What lessons can we learn from this postwar history of recessions? First of all, each one has its own distinct story based on conditions unique to that time. Second, recessions in the modern era are not just the product of natural economic cycles, but also of the latent systemic pressures that exist in a highly interlinked and mutually dependent global capital market. Third, an economy driven by a singular focus on asset price appreciation is capable of producing higher portfolio returns during growth cycles – and higher losses during the downturns.

Assuming that we do experience a recession in 2023, which we believe is likely if the Fed holds true to its inflation-fighting commitment, it has the potential to be more like a classic cyclical downturn than any of the more recent recession have been – more like 1990, for example, than 2001 or 2008. In this scenario the Fed will keep raising rates until it is convinced that high inflation has come down to stay, unemployment will rise, while business investment and household spending will slow. Assuming this scenario with no externalities (e.g. a market failure somewhere or an extreme geopolitical crisis), then it would be plausible to make a case for equity markets testing their lows in the near term and then rising in a post-trough growth cycle.

The key variable there is “no externalities.” In the wake of the recent debacle in the UK gilt market that we covered in last week’s commentary, there are growing concerns about something “breaking” in the market that would require intervention in the manner of the Bank of England’s needing to step in and buy gilts so as to forestall a collapse of major UK pension plans. In our world of very interlinked monetary instruments, the potential for breakage is always there. For portfolio performance to follow a more orderly path from recessionary downturn to post-trough growth, which is our base case scenario, things not breaking is a critical component.

We look forward to sharing with your our more in-depth analysis of “recessionomics,” expanding on the themes of this commentary, in the next several weeks.

MV Financial

Meet Our Team

Smart Strategies.

Investment Advisor Company