Meet Our Team
MV Weekly Market Flash: Strange Times in the Bond Market
MV Weekly Market Flash: Private Equity Not Immune from the Troubles
MV Weekly Market Flash: The Post-Distortion Economy
MV Weekly Market Flash: Earnings and Inflation Are Top H2 Concerns
MV Weekly Market Flash: Europe’s Sea of Troubles
MV Weekly Market Flash: The Earnings Puzzle
MV Special Update: 06/14/2022
MV Weekly Market Flash: What the Fed Can (and Cannot) Do About Inflation
MV Weekly Market Flash: Good News, Bad News
MV Weekly Market Flash: Go Away, or Stay to Play

MV Weekly Market Flash: Strange Times in the Bond Market

Read More From MV

Few pronouncements strike as much dread into the hearts and minds of investors as those ominous three words: “yield curve inversion.” When yields on bonds with longer maturities fall below those with shorter time horizons, there’s a reasonable chance that a recession is on the way – at least according to the data going back many decades. As always, though, there are caveats to the “inversion therefore recession” logic. False positives have occurred, most recently when the 10-year and 2-year Treasury notes briefly inverted in September 2019. That fleeting inversion was in fact followed by a recession in March 2020,...

Read More

MV Weekly Market Flash: Private Equity Not Immune from the Troubles

Read More From MV

It has been a tough year so far for the traditional asset classes of stocks and bonds. Rising interest rates, inflation and concerns about economic growth have all taken a toll on performance. Not surprisingly, we have seen a lot of marketing effort extolling the benefits of alternative assets – things that are supposed to act as hedges against the prevailing trends besetting stocks and bonds. To be sure, when it comes to alternative asset classes the performance often does not back up the marketing hype. Cryptocurrencies, to name one egregious example, were (according to many of their promoters) supposed...

Read More

MV Weekly Market Flash: The Post-Distortion Economy

Read More From MV

If you spend any time listening to professional economists opining on what lies in store in the months ahead, you would be forgiven for coming away confused. Are we heading into a recession? Maybe, maybe not. It is entirely possible that the real rate of GDP growth for the second quarter will come in negative when the report comes out later this month. The Atlanta Federal Reserve Bank runs a predictive model called GDPNow, which forecasts a decline of 1.9 percent for Q2 GDP as of today. But that prediction is well below the consensus estimate of about 3 percent...

Read More

MV Weekly Market Flash: Earnings and Inflation Are Top H2 Concerns

Read More From MV

And just like that…it’s already the second half of 2022. Not too many folks other than habitual short sellers and permabears will be sad to see the year’s first half slide into the history books. The big headline making its way through financial news platforms today is that the stock market’s performance in the year to date is the worst since 1970, fully 52 years ago. That headline should come with an asterisk (though of course it won’t), in that the period from January 3 to June 30 2022 is not anywhere close to being the worst six month stretch...

Read More

MV Weekly Market Flash: Europe’s Sea of Troubles

Read More From MV

We have talked a bit in recent commentaries about the so-called “bad news is good news” phenomenon, where underwhelming economic reports actually help boost stock market sentiment. The underlying theory seems to be that as recession fears increase, inflationary concerns will subside and – punch line – the Fed and other central banks will back off at least somewhat from interest rate hikes (to be clear, this is not what actual Fed members are saying). This week we had a handful of worse-than-expected reports, accompanied by a growing chorus of downturn expectations from economists, and sure enough markets have turned...

Read More

MV Weekly Market Flash: The Earnings Puzzle

Read More From MV

Stock markets will be closed this coming Monday, marking the first time that US financial institutions will shut down in honor of Juneteenth. roziupasaulis.lt alghalyacar.com mightybookjr.com Many investors will no doubt appreciate the extra day of peace and quiet after a week of seemingly unrelenting turbulence, and the chance to think ahead as to what may lie in store. One of the near-term events likely to have an impact on sentiment is earnings season for the second quarter, which will get under way in the first half of July. This is likely to reveal much about how inflation, consumer sentiment...

Read More

MV Special Update: 06/14/2022

Read More From MV

To Our Valued Clients: Yesterday, the S&P 500 stock index closed down 21.8 percent from its last record high reached on January 3 of this year. Long-standing custom in financial markets defines a bear market as a decline of 20 percent or more from a prior peak. When these events happen, you can expect to see headlines normally reserved for the financial pages jump to page one headline news. Useful information, though, often gets lost amid the hyperventilating commentary and endless images of scary-looking red charts pointing downwards. We want to make sure that you have the information you need...

Read More

MV Weekly Market Flash: What the Fed Can (and Cannot) Do About Inflation

Read More From MV

After a few days of fairly listless trading, US equity markets took a deep dive late in the day on Thursday; protective cover, perhaps, for those fearing a hotter than expected inflation report on Friday morning when the Bureau of Labor Statistics was due to release the May Consumer Price Index report. That defensive impulse would seem to be validated, as the numbers for both headline and core (ex-food and energy) inflation did come in ahead of expectations. The CPI report is the last piece of hard data members of the Fed’s Open Market Committee will take into their monetary...

Read More

MV Weekly Market Flash: Good News, Bad News

Read More From MV

In the long run, a healthy economy and a healthy stock market go together. In shorter cycles of activity, though, the correlation between the two is inherently unpredictable. It’s always worth remembering that economic reports are by nature backwards-looking, while markets look ahead to what might lie in store in the future. Just this week, for example, there has been a spate of relatively good news about the economy as reflected in consumer confidence (still fairly high despite rising prices), manufacturing and non-manufacturing business activity, and finally today’s monthly jobs report showing better than expected payroll additions with an unemployment...

Read More

MV Weekly Market Flash: Go Away, or Stay to Play

Read More From MV

This year it seems that the old-timers on Wall Street have it at least partly right. “Sell in May, go away” goes the timeworn chestnut. Investors certainly have fulfilled the first part of that command. Barring some completely unexpected turnaround between now and the day after the holiday long weekend, the not-so-merry month of May will add another notch to the ever-growing calendar of 2022 loser months. Whether folks go away or not is a more open question. Sentiment continues to be broadly negative. To cite a few examples, the bullish indicator in the Investors Intelligence report is below its...

Read More
MV Weekly Market Flash: Strange Times in the Bond Market

Few pronouncements strike as much dread into the hearts and minds of investors as those ominous three words: “yield curve inversion.” When yields on bonds with longer maturities fall below those with shorter time horizons, there’s a reasonable chance that a recession is on the way – at least according to the data going back many decades. As always, though, there are caveats to the “inversion therefore recession” logic. False positives have occurred, most recently when the 10-year and 2-year Treasury notes briefly inverted in September 2019. That fleeting inversion was in fact followed by a recession in March 2020, but that recession was a deliberate decision to turn off the entire economy based on an event nobody knew anything about in September 2019.

Et Tu, Six Month Bill?

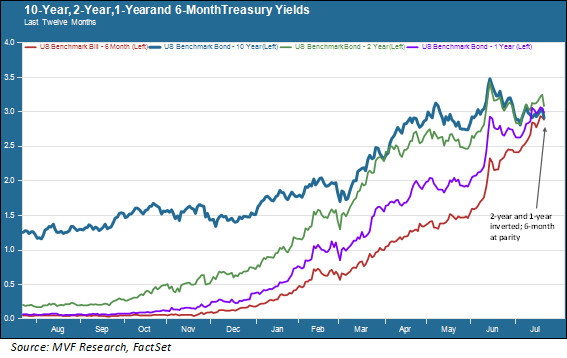
False positives aside, the current shape of the yield curve really does look like the bond market expects a recession to show up in the not-too-distant future. Not just the 2-year, but the 1-year and even the 6-month Treasury bill are now inverted to the 10-year note. The 6-month was at parity with the 10-year based on yesterday’s close (see chart below) but in early morning trading today the yield on the 6-month is 2.86 percent versus 2.77 percent for the 10-year note.

Interestingly, the compression in longer-dated maturities has been having a mostly positive effect on the stock market this week, particularly the growth-oriented parts of the market that benefit more from lower interest rates. The 10-year Treasury is widely used as a benchmark for calculating a firm’s cost of capital, so when that rate goes down, the firm’s value goes up. Over the past several weeks growth stocks, which suffered the brunt of the stock market’s pullback earlier this year, have outperformed their value stock counterparts by a substantial margin.

It’s Worse In Other Places

Part of the explanation for the inverted curve, though, may have nothing to do with any recession potential and a great deal to do with the fact that things in other parts of the world are worse than they are here at home. The US dollar has risen sharply against other major currencies including the euro, the British pound sterling and the Japanese yen, at times rising to levels not seen in more than 20 years. A stronger dollar increases the attractiveness of US assets. Intermediate and long-term Treasury securities are a core holding for foreign central banks and financial institutions.

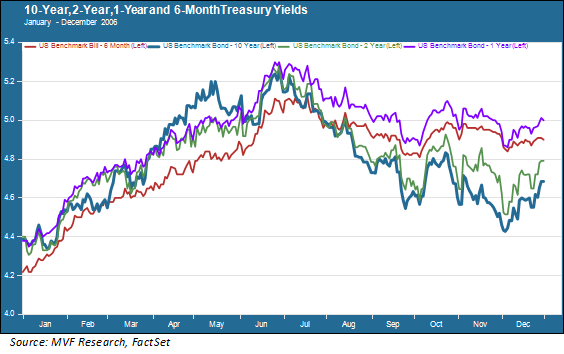
In fact, one of those “false positive” moments for inverted yield curves happened during another instance of monetary tightening by the Fed. In 2006 then-Fed chair Ben Bernanke expressed puzzlement as to why the 10-year yield was lower than those of the shorter maturities. The chart below is a replica of the one above for the period from January to December 2006, and you can see that the inversion lasted for the better part of that year’s second half.

The answer to Bernanke’s puzzlement turned out to be massive demand for intermediate and long US Treasuries by foreign institutions, above all China’s central bank for purposes of foreign currency reserves. Today, with China in seemingly perpetual Covid lockdown, Europe dealing with a full plate of social, political and economic crises, and threats of more emerging market debt defaults following Sri Lanka’s lead, the case for US Treasuries would appear likewise strong.

Maybe Yes, Maybe Mild?

The probability of some flavor of recession in the next six months is almost certainly north of zero, and perhaps well north. But there is almost nothing in the current batch of macroeconomic data to suggest that if one were to occur it would be of the gut-wrenching variety like 1980 or 2008. A more likely comparison would be 2001, when the economy was technically in recession for eight months but never even saw two consecutive quarters of negative growth. A mild recession may well be the price to pay for bringing inflation down. That would be preferable to, say, avoiding recession entirely but living with a protracted period of slow growth and high inflation similar to the 1970s.

And maybe that outcome is, in fact, what the bond market is signaling. Credit risk spreads between Treasuries and lower-rated investment grade corporate securities have risen slightly in recent weeks but are still below their three-year averages, suggesting that fears of an approaching wave of corporate defaults are not present. We will see more pieces of the puzzle come together in the coming weeks with the release of Q2 GDP and the bulk of earnings reports from major S&P 500 constituents. For now, though, the strange shape of the yield curve is not telling us to run for the hills.

MV Weekly Market Flash: Private Equity Not Immune from the Troubles

It has been a tough year so far for the traditional asset classes of stocks and bonds. Rising interest rates, inflation and concerns about economic growth have all taken a toll on performance. Not surprisingly, we have seen a lot of marketing effort extolling the benefits of alternative assets – things that are supposed to act as hedges against the prevailing trends besetting stocks and bonds.

To be sure, when it comes to alternative asset classes the performance often does not back up the marketing hype. Cryptocurrencies, to name one egregious example, were (according to many of their promoters) supposed to provide a gold-like hedge against equities. Scarcity value, right?! That theory hasn’t worked out too well in the real world. Another asset class hailed by many as a port in a storm is private equity, a $4.6 trillion market that ran hot in 2021 with $850 billion in new deals done by private equity funds. Because the companies that make up private equity portfolios don’t trade on public securities exchanges, they do not bear the visible scars of the companies whose valuations, marked to market every day, have suffered during the 2022 downturn. Is the confidence expressed by many in this sector of the market justified, or are there likely to be tough times ahead?

It’s Still Equity

Despite generally being classified as an “alternative” asset class, it’s important to remember that at the end of the day it’s still basically equity. A private equity fund (or partnership – we’ll use the terms interchangeably although there are legal distinctions) is a pool of interests in the equity (mostly common equity) of companies in much the same way that regular mutual funds are. The key difference is that the shares of the private companies do not mark to market every day, which matters considerably when it comes to valuations and returns – we will come back to this issue below.

Another notable difference between private equity funds and their mutual fund counterparts is that the general partners (i.e. the fund’s operational managers) own a much larger stake in the companies and thus take a more active role in the management of the underlying businesses. One of the common themes among private equity managers is their claim that their business management skills are superior to those of the businesses they are taking over. Whether that is true or not is a matter of opinion, at best, and not necessarily validated by the evidence to date.

Again, though, when all is said and done, what you have in the portfolio of your typical private equity fund is a pool of equities (sometimes enhanced with preferred stock or other instruments). Since they are not valued by the day-to-day movements of prices on publicly traded stock exchanges, there have to be other ways to determine what these shares are worth. Here is where the travails of 2022 in the year to date may be about to catch up with private equity.

Comparable to What?

The method of choice for valuing an illiquid private company is to impute a value based on what comparable companies are being bought and sold for. Private equity funds achieve exits for the assets in their portfolios via stock exchange listings (IPOs) or private sales to other companies (M&A). The conditions for both the IPO market and M&A are very much affected by the changing conditions in global capital markets.

Take IPOs. In 2021 the IPO market was hot as the stock market surged. As we noted above, the benign conditions last year facilitated $850 billion in private equity transactions. But in 2022, not surprisingly, the IPO market has tanked. As the universe of “comparables” starts to reflect the reality of the 2022 stock market you can expect to see those valuations drop accordingly. Likewise, private sales via M&A are also starting to reflect a more conservative mindset among companies on the hunt for strategic acquisitions as they face the challenges of persistent inflation and the potential for a recession at some point in the near to mid-term future – not the conditions likely to make one want to pay top dollar for a company. This has led to the somewhat curious trend recently of private equity firms buying and selling their assets to each other rather than to external buyers – something that may goose numbers in the short term but is unlikely to be sustainable.

Losing Leverage

The other challenge for private equity will be in financing new deals. There is currently some $1.3 trillion of so-called “dry powder” – money invested in private equity funds that has not yet been deployed into new investments and is thus idly sitting in cash for the time being. The biggest tailwind to financing new deals in the past couple years – to say nothing of the previous decade – was the easy money that flowed from the Fed’s zero interest rate policy. About 50 percent of all private equity transactions are funded by debt – mostly from riskier sectors of the $3 trillion private debt market like leveraged loans. This market has been hit hard by the rise in interest rates. High yield (speculative) debt with a C credit rating currently trades around a 14 percent yield. As the cost of capital goes up, the valuation of assets funded by that capital goes down.

The last twelve years have been very good to private equity. The good times are unlikely to last much longer. Investors thinking they are getting a comfortable hedge from the troubles in public equity and debt markets may be in for a rude awakening and some tricky currents to navigate ahead.

MV Weekly Market Flash: The Post-Distortion Economy

If you spend any time listening to professional economists opining on what lies in store in the months ahead, you would be forgiven for coming away confused. Are we heading into a recession? Maybe, maybe not. It is entirely possible that the real rate of GDP growth for the second quarter will come in negative when the report comes out later this month. The Atlanta Federal Reserve Bank runs a predictive model called GDPNow, which forecasts a decline of 1.9 percent for Q2 GDP as of today.

But that prediction is well below the consensus estimate of about 3 percent positive growth supplied by Blue Chip Economic Indicators. Indeed, the lower band of the Blue Chip forecast, which is an average of the 10 lowest estimates in that survey, still comes in at just below two percent positive growth. Everyone’s looking at the same numbers, but coming up with different predictions. What gives?

Fields of Distortion

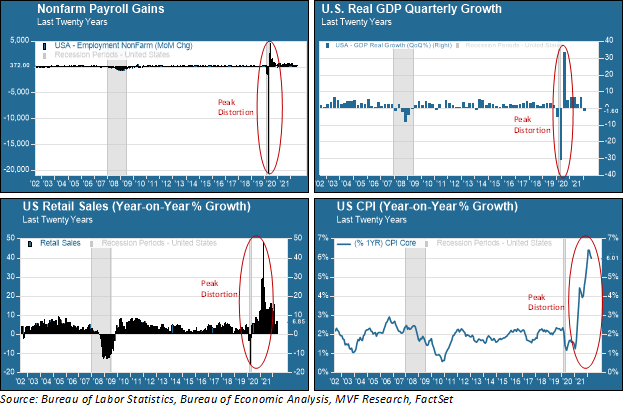
Making light of economists’ predictions, of course, is low-hanging fruit for comedians who feed off the quirks and foibles of financial markets. “They’ve predicted ten of the last five recessions” or variations thereof goes a popular line among Wall Street’s would be Borscht Belt wags. But spare a thought for the practitioners of the dismal science, for they have been dealt an unkind hand by the gale-force winds of distortion in the past couple years. Consider the following chart, with a selection of key macroeconomic indicators going back twenty years, to see what today’s economists have to try and make sense of.

Simply put, the economy’s performance since the pandemic began bears no resemblance to any previous period since the numbers started to be compiled and presented in a meaningful way after the Second World War. After the longest growth cycle on record, from 2009-20, we had the shortest recession on record. That recession, which saw the deepest fall in GDP since the Great Depression, was followed by a furious influx of fiscal and monetary stimulus leading to the off-the-charts numbers for retail sales (bottom left chart above) and, eventually, inflation (bottom right).

None of this was natural and organic – not the decision to shut down the economy, not the decision to put government money directly into the bank accounts of households and businesses, and not the decision by the Fed to park interest rates at zero and promise to buy whatever securities it had to in order to keep financial markets afloat. When you look at these numbers and others like them (e.g. the unprecedented increased in the M1 money supply), how are you supposed to make an empirically sound forecast for what comes next?

More Secular Stagnation?

Some are making the case that the most likely outcome for the post-distortion economy will be a return to what we had in the 2010s – below-trend economic growth, a return to subdued wages and lower price inflation, and an activist Fed ready to prime the pump with easy money in order to grease the wheels of the financial system. There is a coherent logic to this case. In the 2010s it was a combination of low productivity, an aging population (lower labor force participation rate) and businesses opting for shareholder givebacks over new capital investment that facilitated subpar growth and moribund wage or price inflation. Neither productivity nor demographics have visibly changed much since then. Nor do businesses appear to have lost their appetite for stock buybacks as a way to goose earnings per share and keep the investment community satisfied. Why should the natural economic trajectory look any different?

The Fog of Transition

While we agree with some of the insights for a return to secular stagnation, we are skeptical of the overall argument that the latter 2020s will much resemble the previous decade. For a great many reasons, by no means all of which have to do with economics and markets, it is a different world today. One of the key ways in which it is different is that the background context of globalization is considerably more tenuous than it was five years ago. World trade as a percentage of world GDP has steadily declined, relations between the two leading economies (the US and China) have become ever more adversarial, much of the growth in emerging economies (in particular those outside of Asia) has stagnated or gone into reverse, and national political institutions in large and small countries alike are in disarray or outright decay.

What happens in the immediate post-distortion economy, in our opinion, is a murky transition – perhaps the closest point of comparison would be the transition from the postwar Bretton Woods economic framework to the globalization, privatization and financialization that took root and grew in the 1980s and 1990s. We expect there will be upsides and downsides to this transition, and potentially transformative developments that ultimately shape a new economic order.

But that’s all in the future. For now, we see the “inflation surprise” period of the post-distortion economy stabilizing and starting to recede, while the “growth surprise” element is more likely to move into the foreground. Earnings season starts next week, and that will be a good warm-up act for the Q2 GDP number we get on July 28.

There is both upside and downside potential in terms of how alternative growth scenarios feed into market sentiment. It would be wise to pay little heed to anyone who tells you they know with high confidence what that means for the next six months on the S&P 500. But growth – or the lack of growth – is going to shape the contours of market opportunities as we head into the middle years of the decade.

MV Weekly Market Flash: Earnings and Inflation Are Top H2 Concerns

And just like that…it’s already the second half of 2022. Not too many folks other than habitual short sellers and permabears will be sad to see the year’s first half slide into the history books. The big headline making its way through financial news platforms today is that the stock market’s performance in the year to date is the worst since 1970, fully 52 years ago.

That headline should come with an asterisk (though of course it won’t), in that the period from January 3 to June 30 2022 is not anywhere close to being the worst six month stretch ever during this half century of activity. The 21.1 percent decline the S&P 500 registered upon its June 30 close falls far short of the bear market drawdowns of 2000-02 (48 percent) and 2008-09 (57 percent), to say nothing of 1987 (34 percent) or 1973-74 (48 percent).

But the 2022 decline had the dumb luck of starting on January 3, the first trading day of the year. That was the last time the S&P 500 hit a record high, meaning that this bear market neatly coincides with the calendar markers everyone obsesses over. Is there any practical difference between a six month stretch that runs from January 1 to June 30 and one that spans, say, March 15 to September 14? Of course not. But we are a calendar-centric species, and so “worst first half since 1970” is here to stay.

Bracing for Earnings

As we look ahead to the second half, there are a couple early hurdles to clear if we are going to avoid having “worst first half” extend to the year’s final two quarters. Already we are getting a preview of how the second quarter earnings season, which officially gets under way late next week, is going to shape up in terms of expectations meeting reality. A handful of companies that report outside the “official” earnings season (usually because their fiscal years do not follow the calendar year) have already warned that forthcoming revenues and earnings are likely to be meaningfully lower than what they previously thought. Micron Technologies and General Motors both cut forward guidance in their reports this morning.

Meanwhile, analysts are still forecasting 2022 earnings to grow by more than 10 percent, higher today than their consensus estimates back in March. That outlook seems destined for a sharp downward revision. Just to cite the Micron Technologies example, in the aftermath of today’s report brokers cut their earnings estimates for the next quarter by more than 20 percent. We can expect to see plenty more where that came from.

How Much More Inflation?

Earnings forecasts are trending lower because consumers are starting to adjust their spending plans in light of the persistence of high inflation. In the coming months we will see how effective the Fed, ECB and other central banks are in taming inflation with their increasingly stringent interest rate targets. The good news, such as it is, is that core inflation does not seem to be accelerating from month to month. The Core Personal Consumption Expenditure measure, which is the Fed’s preferred inflation gauge, showed an increase of 0.35 percent from April to May, which is roughly the same month-on-month increase seen in the four previous periods. That’s good. But the core measure excludes the two things most households care about the most – food and gas prices – and those are largely beyond the control of central bankers. That’s not so good.

Things are worse over in Europe, as we discussed in our commentary last week. The Eurozone CPI report for June came out this morning, and it shows an 8.6% year-on-year increase in headline inflation, higher than economists forecasted. There is not likely to be much relief for beleaguered European households as long as the war in Ukraine drags on – and with the days of cold weather inching ever closer, the energy problem in particular is going to be vexing.

What’s Next?

So what does this mean for portfolios? How much of the reality about earnings and inflation has already been baked into the cake, so to speak? There are no clear answers to that, but we think it is reasonable to expect more intermittent rallies and pullbacks of short duration, similar to what we have seen in the past month or so. Just since late May we have seen the S&P 500 rally by more than 6 percent on two separate occasions, only to fall back after stalling out. These “dead cat bounces” don’t do much to improve longer-term sentiment, but they do act as a brake against things going from negative to all-out panic.

In fact, despite being stuck with the “worst first half since 1970” label, what we really did not see in the first six months of 2022 was panic selling. We think this is in large part due to important differences in today’s environment versus, say, the pandemic pullback in March 2020 or the financial crisis of 2008. Those were genuine panic-inducing events: in one, that the whole world was getting sick from this rampaging virus, and in the other that the entire global financial system seemed to be on the edge of collapse. Investors couldn’t get to the exits fast enough.

What we have today is different. We have a clear problem, which is inflation, and we have clearly identified agents – central banks – trying to fix that problem with as little collateral economic fallout as possible. We have external variables that have made the problem worse, notably the war in Ukraine and China’s zero-Covid lockdown, but we also have a strong labor market and (at least up to now) resilient consumer spending. This kind of environment lends itself to speculation about different outcomes, which are getting fleshed out in market chatter using the analogy of landing a plane – hard, soft, bumpy, short runway, aircraft carrier, air traffic control, and on and on. The point is, there are coherent cases to make for a variety of scenarios. As long as that is the case, we expect this push and pull dynamic to continue – high intraday volatility with periodic pullbacks and relief rallies. We don’t think this is the right time to be calling a screaming buy on the market; nor do we think it is a slam-dunk sell. Stay the course is our advice as we head into H2 2022.

MV Weekly Market Flash: Europe’s Sea of Troubles

We have talked a bit in recent commentaries about the so-called “bad news is good news” phenomenon, where underwhelming economic reports actually help boost stock market sentiment. The underlying theory seems to be that as recession fears increase, inflationary concerns will subside and – punch line – the Fed and other central banks will back off at least somewhat from interest rate hikes (to be clear, this is not what actual Fed members are saying). This week we had a handful of worse-than-expected reports, accompanied by a growing chorus of downturn expectations from economists, and sure enough markets have turned in a mostly positive performance. Though, to be fair, it may not necessarily be all that surprising to see a few days of modest gains follow the unrelenting losses that have made up much of the month to date prior to this week.

Highway to the Danger Zone

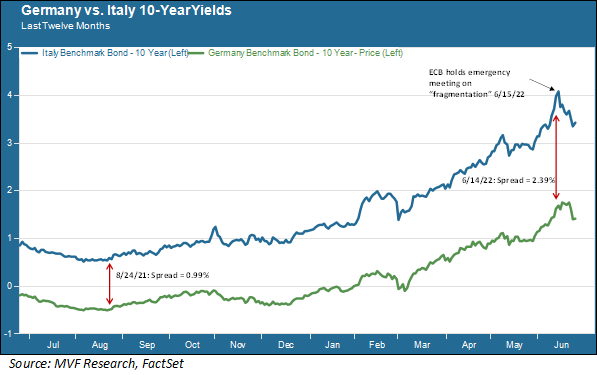
If traders are looking for bad news they need look no further than Europe, which has plenty to go around. Let’s start with bond yields. On June 15 the European Central Bank held an emergency meeting to discuss the growing problem of fragmentation between the region’s stronger and weaker sovereign credits. At the top of the list of credit concerns was Italy. Yields on 10-year Italian government bonds were topping four percent, which one ECB member (perhaps having recently watched the original “Top Gun” for the umpteenth time) called “approaching the danger zone.” The chart below shows the twelve-month performance of 10-year Italian sovereign debt against the benchmark German Bund.

At the June 15 emergency meeting the ECB announced it would commit to a “new instrument” to tackle the problem of widening spreads between stable credits like Germany and weaker sovereigns like Italy and Spain. The “danger zone” sentiment relates to the fact that Italy’s debt-to-GDP ratio is considerably higher, at about 155 percent, than it was the last time credit conditions in the Eurozone approached crisis levels, in 2011-12. Back then it took three words from then-ECB head Mario Draghi – “whatever it takes” – to pull markets back from the danger zone. Draghi is no longer there (in fact, he is now Italy’s prime minister) but the ECB message of a new instrument – probably a variation of one of the bond-buying programs already in place – seemed to be enough to placate nervous bond traders. Whether that confidence lasts until the central bank gets around to explaining what this new instrument actually is – probably at their next rate policy meeting on July 21 – is another matter.

The Messaging Challenge from Hell

One big reason why the lull in widening credit spreads might not last is that any kind of new bond-buying program flies in the face of what the ECB had announced just one week earlier, at its policy meeting on June 9. In the face of what is by far the highest inflation the Eurozone has faced since it became a single currency zone in 1999, the bank announced that it was likely to raise interest rates by a quarter percent in July and then by half a percent in September. In many ways the ECB has been playing catch-up with the more aggressive shifts towards monetary tightening at the Fed and elsewhere. The rate announcement after the June 9 policy meeting was more hawkish than many economists expected. Inflation is expected to remain high for some time, particularly given that European energy markets are much more vulnerable to the disruption in Russia and Ukraine than US markets are.

The problem, then, is how to explain on the one hand that the central bank is going to take tough action on rates to bring down inflation, while on the other hand injecting more monetary stimulus into certain parts of the region to bring down already-high rates? The market places a high premium on messaging guidance from central banks. Good messaging optics have been hard to come by anywhere recently as the monetary mandarins have struggled to recalibrate their expectations about inflation and growth. But it is particularly hard for the ECB, an institution not generally known for high-caliber messaging discipline, when the underlying message itself is so potentially contradictory.

Running Low on Gas

The economic problems facing the Eurozone are not likely to improve in the near term. This week the head of German utility RWE warned that the continent will face chaos this winter if they don’t act now to establish rules on energy sharing to prepare for the likelihood of further cuts in gas exports from Russia. Gas volumes on the Nordstream 1 pipeline, a major conduit of energy from the Siberian gas fields to German homes, were recently cut by about 60 percent ahead of some scheduled maintenance on the pipeline. So far the volume cuts have not been offset by increases through other pipelines. It’s not yet time for German households to start rationing gas, say the authorities, but that time may fast be approaching. The International Energy Agency has warned that Europe needs to prepare for the possibility of a full cessation of gas supplied from Russia. In that event rationing will certainly be in the cards – hence the RWE warning to start preparing consistent rules and standards now.

Stagflation, the word that came back into vogue in 2022 after a 40-year hiatus, is still far from a certainty in the US. But the probability for high inflation coupled with low or negative growth to persist in Europe for some time seems to be increasing. After the negative shocks of war in Ukraine and China’s zero-Covid flailing, Europe perhaps more than anywhere could use a positive shock or two.

MV Weekly Market Flash: The Earnings Puzzle

Stock markets will be closed this coming Monday, marking the first time that US financial institutions will shut down in honor of Juneteenth. roziupasaulis.lt alghalyacar.com mightybookjr.com Many investors will no doubt appreciate the extra day of peace and quiet after a week of seemingly unrelenting turbulence, and the chance to think ahead as to what may lie in store. One of the near-term events likely to have an impact on sentiment is earnings season for the second quarter, which will get under way in the first half of July. This is likely to reveal much about how inflation, consumer sentiment and growth prospects are reverberating in the executive C-suite.Double Tailwind for the P/E Ratio

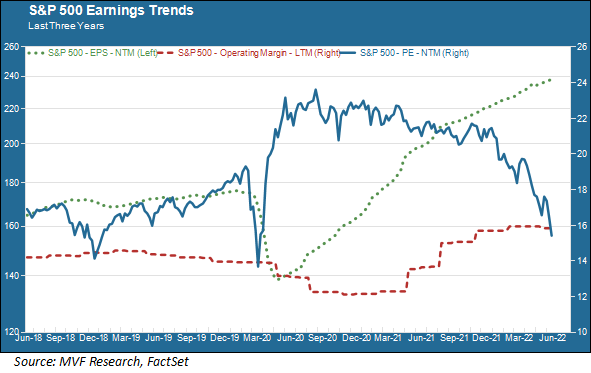
The chart below shows the next twelve months (NTM) P/E ratio along with the earnings per share forecast (green dotted line) and the trailing twelve months (i.e. actual reported) operating margin (crimson dotted line) for S&P 500 companies. There is a lot going on in this chart, and we’ll explain it all below.

The chart shows that the forward P/E ratio has come down considerably, from just under 24 in late 2020 to 15.4 times today. By this measure stocks are quite a bit cheaper today than they were then – in fact, they are at levels last seen in 2018. But are they cheap enough to suggest a turnaround in sentiment from negative to positive? That’s where it gets tricky.

Let’s do a quick refresher of P/E math. The numerator – stock prices – is clearly lower because of what has taken place in the market so far in 2022. But while prices have been coming down, earnings forecasts – the denominator – have continued to rise (see the trend for the green dotted line). So the P/E has fallen both because of falling share prices and because of rising earnings estimates. It would be great if those rosy earnings estimates would continue indefinitely. There is good reason, though, to think they won’t.

Margins Matter

Profit margins are what everyone will be focusing on with laser-like intensity in the upcoming earnings season. In the above chart, the crimson dotted line shows that operating margins (i.e. operating profits as a percentage of sales) have risen steadily since the pandemic and remain well above their levels in 2018 and 2019. What does this mean? It means that even while dealing with sharp increases in virtually every category of input costs – from raw materials to freight and other logistics costs to labor – companies have been able to more than offset those cost increases by raising their selling prices. If you dig into the profit composition of many companies you will see that they are selling fewer units – for a variety of reasons including disrupted supply chains – but that the unit price at which they are selling is high enough to more than compensate for the lower volumes. As a result, profit margins have remained resilient.

Sentiment Sours

That resiliency is fragile. Last Friday, while all the attention was focused on the higher-than-expected inflation shown in the Consumer Price Index report, another data point came out courtesy of the University of Michigan Survey of Consumers, an index of consumer sentiment and expectations. This index fell to its lowest recorded value, comparable to the level at the bottom of the 1980 recession. Inflation, it would seem, is now firmly fixed in the minds of US households. That in turn suggests that consumer spending habits are likely to change, with some discretionary categories getting tossed out entirely while families economize on their weekly staples of food, clothing and transport.

It’s not entirely clear how much of this change in consumer sentiment is going to show up in the reported numbers as companies discuss their second quarter results. But it is very likely to show up in their forward guidance. As of today, the FactSet analyst consensus for full year 2022 is for earnings per share to grow by more than ten percent. We would frankly be surprised if that estimate is still standing when the Q2 earnings season concludes.

Better Here Than There

The good news is that, as dour as things may look in terms of the current market environment, the US economy still appears to be in vastly better shape than others around the world. The Eurozone has its own set of problems, which we will be discussing in more detail in forthcoming commentaries. China is still stuck in a problem of its own making with the government’s refusal to back off from the unrealistic zero-tolerance policy for Covid. It cannot be any fun to be a resident of Shanghai these days.

Those problems do affect us indirectly, but they have a more direct impact on their own citizens. On a relative basis, we expect the US economy to be better equipped to navigate the current troubled seas. Eventually, that means we should expect to come out stronger.

MV Special Update: 06/14/2022

To Our Valued Clients:

Yesterday, the S&P 500 stock index closed down 21.8 percent from its last record high reached on January 3 of this year. Long-standing custom in financial markets defines a bear market as a decline of 20 percent or more from a prior peak. When these events happen, you can expect to see headlines normally reserved for the financial pages jump to page one headline news. Useful information, though, often gets lost amid the hyperventilating commentary and endless images of scary-looking red charts pointing downwards. We want to make sure that you have the information you need to understand what the current market environment may mean for your portfolio and your long-term financial goals, and hope that this brief commentary will help you put current events into context. We are always available for a direct conversation if you have additional questions or concerns you want to discuss.

What Causes Bear Markets?

By the definition we described above of a 20 percent or more pullback from a prior market high, there have been 13 bear markets since 1946. The average magnitude of the decline from peak to trough was 32.1 percent. It is important to understand, though, that each of those 13 events arose because of a set of circumstances unique to that time and place.

For example, just consider the two most recent instances. In March 2020 the stock market retreated by 34 percent from the high point reached just a month earlier. The circumstances around that event – a global pandemic and a deliberate decision by governments around the world to shut down their economies – are clearly specific and not transferable to the driving factors of other market cycles.

In September 2008 the securities firm Lehman Brothers went bankrupt, and the ensuing chain of events very nearly dragged the entire financial system into collapse. The excesses in the system that made this near-collapse possible, primarily the heavily leveraged exposure to certain types of fixed income securities by major banking institutions, have to a large extent been remedied by regulatory measures and the extent to which the institutions themselves have cleaned up their financial vulnerabilities. A systemic meltdown of the system is a much more remote possibility today, 14 years later.

Inflation, the Fed and Interest Rates

The fundamental driver of today’s market environment is inflation. Inflation became a problem in the middle of 2021 when consumer-driven demand, fueled by a massive infusion of money into the system by expansive fiscal and monetary policy, ran headlong into shortages of key goods from companies still rebuilding manufacturing supply chains disrupted by the pandemic. Those problems may well have peaked and begun to decline by now except for two additional disruptions that occurred earlier this year. Russia’s invasion of Ukraine in February had a direct impact on energy and food markets, which impact has deteriorated even further as the war approaches its fourth month. The second disruption was China, where a draconian policy of zero tolerance for Covid resulted in protracted shutdowns in major industrial centers, notably including the port city of Shanghai, which is also the nation’s financial capital.

The persistence of high inflation has forced the Federal Reserve to take increasingly strong steps to combat its effect, namely by raising interest rates. Many of the companies whose stock prices have been the highest flyers of recent years are technology-intensive businesses with a high degree of vulnerability to rising interest rates – hence the outsize negative performance of stock indexes like the tech-heavy Nasdaq Composite relative to the broader market. Last Friday, a report by the Bureau of Labor Statistics showing a higher than expected rise in the Consumer Price Index in May triggered another bout of intense selling by equity investors, bringing us to yesterday’s bear market close.

The Morning After

The last time we experienced an inflation-driven bear market was in 1980, when then-Fed chair Paul Volcker raised interest rates to unprecedent heights – a Fed funds rate of 20 percent at its peak – to finally break the back of the inflation that had afflicted the economy throughout the 1970s. On this point it is worth noting that interest rates today are nowhere close to where they were then. Most economists see the Fed raising rates to a maximum somewhere between 3.0 – 4.0 percent. That is a rather modest level for peak interest rates based on historical comparisons.

But there is an additional context which needs to be considered in thinking about today’s environment. The pullback of 2022 comes directly on the heels of one of the most pronounced bull runs in market history, from the immediate aftermath of the March 2020 coronavirus panic through the go-go months of 2021. Investors threw caution to the wind as they chased all manner of things from meme stocks like AMC and GameStop to cryptocurrencies and NFTs. In debt markets, yield-starved investors sought to benefit from anything from junk bonds to pools of illiquid loans. At the end of 2021 the average nominal yield on high yield (i.e. junk) securities was well below the prevailing rate of inflation.

So the market pullback driven fundamentally by inflation and interest rates comes at a time when the market is having something of a morning-after hangover from last year’s excesses. So what comes next?

Patience Pays Off

Our message to our clients in 2021 was that investing in things like crypto and meme stocks was a bad idea, because they lacked a fundamental investment case (in our opinion) for long-term financial goals. In 2022, our message is the flip side of that. Panicking because of the current economic disruptions is a bad idea. As a long-term investor you want to manage two objectives simultaneously: to gain exposure to long term growth and to protect your downside. The way to do this is twofold. First, be confident that the growth-oriented assets you hold are economically viable; in other words, for example, companies with strong cash flows that can persevere through a full business cycle. Second, keep a portion of your portfolio in high-quality, low-risk assets to serve as a cushion for those times (like today) when the ride gets bumpy. Our asset allocations to short-term, high quality bonds have helped perform this function.

Over the years we have always tried to stress the importance of patience. Patience comes from knowing that market cycles come and go. Sometimes it seems like a cycle will last forever, and yet all the evidence of investing throughout history points to the conclusion that cycles do come to an end – good and bad cycles alike. Patience is the antidote to fear and greed. In 2021 it helped us resist the temptation to speculate on things we instinctively felt were bad ideas. In 2022 it will help us resist the urge to throw in the towel and sell out of the good assets we want to have on hand when the market turns back up. At some point, we imagine that sharply lower valuations may present an opportunity for some strategic buying. For now, the key message is to keep disciplined while we closely monitor all the economic, social and political forces at play here and around the world.

We hope these comments will be of help to you; however, if there is anything else we can do to answer your questions or concerns, please do not hesitate to reach out. We are always here to help in any way that we can.

MV Weekly Market Flash: What the Fed Can (and Cannot) Do About Inflation

After a few days of fairly listless trading, US equity markets took a deep dive late in the day on Thursday; protective cover, perhaps, for those fearing a hotter than expected inflation report on Friday morning when the Bureau of Labor Statistics was due to release the May Consumer Price Index report. That defensive impulse would seem to be validated, as the numbers for both headline and core (ex-food and energy) inflation did come in ahead of expectations.

The CPI report is the last piece of hard data members of the Fed’s Open Market Committee will take into their monetary policy meeting next Tuesday and Wednesday. That meeting is widely expected to result in another increase of 0.5 percent in the Fed funds target rate, with another one to follow when the FOMC meets again in July. As we noted in our commentary last week, the big question market participants have been debating in recent weeks is whether economic conditions support a “peak Fed/peak inflation” narrative that would imply a more subdued path for rate hikes following the June and July measures.

Today’s inflation report suggests (as we also opined in last week’s commentary) that it may be too early to bake peak anything into the cake. But it also brings into focus a broader question: what can the Fed actually do about inflation, and what are its limits?

Groceries, Gas and Everything Else

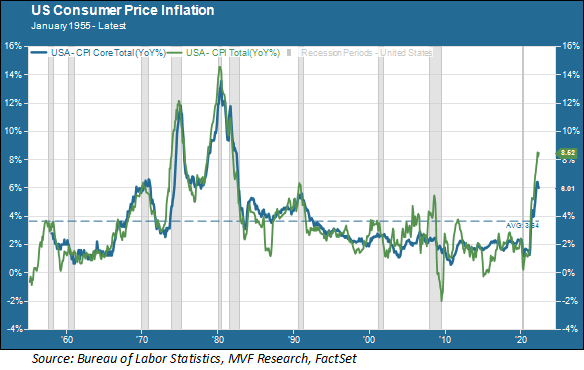
The chart below shows the path of headline and core inflation in the US from 1955 right up to this morning’s CPI report. Headline inflation (i.e. all categories) is represented by the green line and core (again, excluding the volatile categories of energy and food) is in blue.

You will notice that in some periods (most notably during the high-inflation era from 1968 to 1982) headline and core inflation move more or less in tandem. In other periods, particularly during the first decade of the 21st century, there was a fairly wide dispersion between core and headline. This was a period which included a commodities supercycle related to China’s rise as an economic power during the early-mid 2000s, and then a bust in energy and other commodity prices following the financial crisis and recession of 2008 (and again when energy prices collapsed in 2014). During these periods you can see the green line (headline CPI) deviating markedly from the blue core trend.

When the Fed talks about fighting inflation it is important to understand that it is talking about core inflation. Essentially what the central bank is saying is that it does not have tools available for controlling what you pay at the grocery store or the gas pump – those prices are driven by supply and demand forces happening all around the world that are not going to change much when US interest rates go up or down. What the Fed hopes is that by raising rates it can influence consumer demand in such a way as to bring down price levels for a broad range of goods and services outside those two volatile categories. The trick, of course, is to dampen demand by just enough to bring down prices without choking off growth entirely and precipitating a recession.

Supply Side Woes

So what does all this mean for the present period? If you look at the headline and core inflation trends for the past year, you can see headline and core inflation rising together, though with a decisive move higher by the headline number in the report that came out today (8.6 percent year-on-year rise in headline CPI and 6.0 percent jump in the core number). That is largely due to the resurgence in both food and energy prices over the past 30 days, a large amount of which is due to the ongoing war in Ukraine. Russia is the world’s largest grain exporter, and Ukraine is the fifth-largest. Russia’s blockade of the Black Sea, preventing Ukrainian grain exports from reaching their destinations, is pushing many countries in Africa and the Middle East into an acute food crisis and a looming famine. True to its stated policy, there is nothing the Fed can do to address this crisis.

There is another problem, though, as it relates to the various categories that make up core inflation, that is also outside the Fed’s purview. Global supply chains, battered by the effects of the pandemic and the insatiable demand for goods that followed, are a major impediment to a normalization in prices. China continues to be a source of instability with its monomaniacal zero Covid policy. Other major supply chain hubs such as Vietnam are also struggling to resume full-capacity operations. The shortage in semiconductor chips continues to affect prices for a wide variety of products including new and used automotive vehicles. Prices for used cars, to give one example, are 16.1 percent higher than they were a year ago according to today’s report.

The equity market already seems to be moving on from “peak inflation/peak Fed.” As always, though, we are more interested in what the bond market will have to say. Although credit risk spreads have trended up recently, the spread between 10-year Treasuries and low-investment grade corporate bonds is still below its three-year average. Five-and ten-year breakeven rates suggest that longer-term inflationary expectations have not broken out of the barn, which in turn implies that a decent degree of confidence remains in credit markets that the Fed will get the job done. That remains our default thinking as well – but we will continue to pay very close attention to developments in those things the Fed cannot control.

MV Weekly Market Flash: Good News, Bad News

In the long run, a healthy economy and a healthy stock market go together. In shorter cycles of activity, though, the correlation between the two is inherently unpredictable. It’s always worth remembering that economic reports are by nature backwards-looking, while markets look ahead to what might lie in store in the future. Just this week, for example, there has been a spate of relatively good news about the economy as reflected in consumer confidence (still fairly high despite rising prices), manufacturing and non-manufacturing business activity, and finally today’s monthly jobs report showing better than expected payroll additions with an unemployment rate of 3.6 percent. Markets have been somewhat cool to the news, though, particularly in early trading this morning following the jobs report.

Hopes for a Pause

Right now the sentiment on Wall Street might be more favorably disposed to anything that shows the economy is not overheating. “Peak inflation” and “peak Fed” have been twin rallying points for whatever bouts of good feelings have countered the overall negative trend in stock prices thus far this year. This hopeful narrative rests on the idea that core inflation may be gradually turning lower and thus making it easier for the Fed to bring its monetary tightening program to a conclusion sooner rather than later (which indeed has a measure of support from some recent inflationary readings).

Last week there was a particularly optimistic take on this narrative when Atlanta Fed president Raphael Bostic opined that the Fed might take a bit of a time out in September after raising rates in June and July to assess the situation. Bostic in no way intended to suggest that the central bank was ready to throw a bone to the stock market, yet “Fed pause” made for a hearty rallying cry as markets headed into the long holiday weekend. If the Fed could conclude by as early as September that things are on the right course, then it would be on track to gently wind down its series of interest rate hikes without pushing into the restrictive territory that would raise the probability of a near-term recession.

Cometh the Hurricane

The sequence of data releases this week suggests it may be too early to bank on the peak Fed narrative. A number of economists have pointed out that the current combination of unemployment below four percent and inflation above four percent is entirely consistent with the conditions for an economy that is overheating. Today’s jobs report in particular suggests that the weird labor market, with 1.9 job vacancies for every unemployed American, has not yet worked itself out (although the report did show that wage gains are still relatively contained).

The fact is, conditions in the current economic cycle really have no precedent in previous cycles of expansion and contraction. We are just two years out from the last recession – which was both the shortest and the deepest recession on record since the end of the Second World War, created entirely by the deliberate decision to shut down the economy in response to the pandemic. That recession was followed by multiple fire hoses of money injected into the economy – which in turn was followed by the X-factors of war in Ukraine and the ongoing vagaries of Covid variants eliciting different policy responses in different parts of the world, most notably China and its zero tolerance measures.

The uncertainty all this creates is what prompted JPMorgan Chase head Jamie Dimon this week to warn that an “economic hurricane” is likely to hit our shores sometime before the end of 2023. That sounds dire as a headline, but the subtext was more nuanced. Dimon made clear he does not know whether that hurricane will be of the manageable Category 1 variety or a more devastating Cat-5 kind of event. And that is sort of where things are right now, with lots of uncertainty, not much in the way of helpful precedents, and an inability to process economic data as either good news or bad news. The one constant in all this is volatility, which more than anything else demands discipline and patience.

MV Weekly Market Flash: Go Away, or Stay to Play

This year it seems that the old-timers on Wall Street have it at least partly right. “Sell in May, go away” goes the timeworn chestnut. Investors certainly have fulfilled the first part of that command. Barring some completely unexpected turnaround between now and the day after the holiday long weekend, the not-so-merry month of May will add another notch to the ever-growing calendar of 2022 loser months.

Whether folks go away or not is a more open question. Sentiment continues to be broadly negative. To cite a few examples, the bullish indicator in the Investors Intelligence report is below its pandemic trough in March 2020. A “Bull and Bear Indicator” put out by Bank of America is at a level the institution calls an “unambiguous contrarian buy” signal, which is similar to Goldman Sachs’s take in its Sentiment Indicator, which has been in oversold territory for five straight weeks for the first time since 2011.

No Bailouts Ahead

None of which is to say that the market is currently ripe for buying the dip in the way that every significant pullback since 2011 has witnessed. Those institutional bull-bear indicators may sound authoritative, but from a statistical validity standpoint they are pretty threadbare. There just aren’t that many bear markets to supply a plentiful sample size. In recent or sort-of-recent memory that would include the financial crisis of 2008 and the tech meltdown of 2000, plus the ever-so-brief technical bear of Pandemic 2020 and a few near misses in 2018, 2011, 1998 and 1990. But whatever. Sentiment is pessimistic, and at some point things will likely seem oversold to enough people to catalyze the dormant animal spirits.

We imagine that might have happened already except for the one thing that makes this pullback different from all other pullbacks since the financial crisis: this time, the Fed is very clearly not on hand to bail out holders of risk assets. The assurance of a liquidity infusion by the Fed, familiarly known as the “Fed put,” is not to be had when the central bank’s singular focus is on engineering a monetary tightening policy that will subdue inflation without sending the economy into recession. Fed chair Powell says this will be very difficult and involve pain. No Easy Street for the stock market in this formulation.

How Much More For Tech?

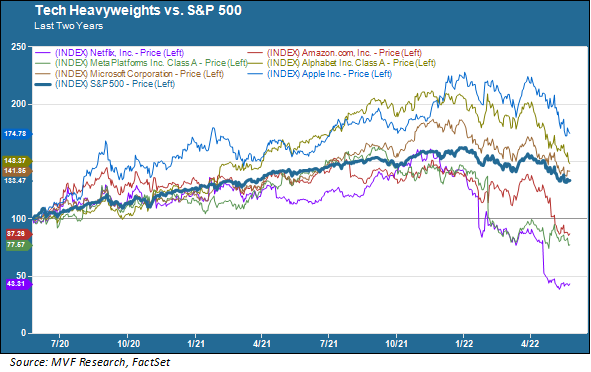
One way to think about when the selling might be due for a respite and turnaround is to ask how much more pain is likely to be in store for Big Tech. The likes of Apple, Microsoft, Facebook, Amazon, Netflix and their ilk provided much of the bulk in driving broader market indexes higher in the past few years, thanks to their outsize market capitalization – by some measures a third of the total market cap of the S&P 500 at their peaks, and an even higher percentage of growth-weighted indexes like the Nasdaq Composite and Russell 1000 Growth index.

That outsize impact has made itself equally felt on the way down.  As the chart below shows, three of the erstwhile high-flyers (Amazon, Meta (Facebook) and Netflix) are trailing the overall S&P 500 on a two-year basis, while another two (Microsoft and Alphabet) are knocking at the door.

The pullback in tech has been broad-based, dragging down both the leaders in their respective business segments shown in the chart above and much less battle-tested wannabees with dicier cash flow growth prospects farther out in the future. Now, based on our simple understanding of the present-day economy, these tech heavyweights aren’t going anywhere anytime soon. The economy is increasingly digitalized. Technology is increasingly the determinative factor separating winners and losers in just about every imaginable industry sector. High inflation is not going to kill that trend; neither will a reversal of GDP growth if that does wind up happening sometime in the next couple years.

Market timing in general is a fool’s errand – this year has already supplied ample evidence of that in the form of, among other things, the war in Ukraine and the supply chain reverberations from Covid lockdowns in China. We imagine there will be more surprises ahead – and those may just as easily be of a positive as well as a negative variety from a market standpoint. But treating the relative fortunes of Big Tech as a leading indicator may not be the worst way to think about when it makes sense to start building up equity exposures again. There may be some opportunities this summer for those who stay to play.

MV Financial

Meet Our Team

Smart Strategies.

Investment Advisor Company