MV Weekly Market Flash: Japan Gives Traders the Head Spins
Read More From MVJapan jumped into an already frothy geopolitical moment last weekend when the Liberal Democratic Party, the country’s ruling party for all but a very brief time since the end of the Second World War, selected Sanae Takaichi as the new head of the party and thus the person likely to succeed outgoing prime minister Shigeru Ishiba. Takaichi, who would thus become Japan’s first female prime minister, is known as a hardline conservative with an economic agenda modeled on the pro-stimulus policies of Shinzo Abe, the former prime minister whose “Abenomics” plan was all the rage back in the mid-2010s. Deer...
Read MoreMV Weekly Market Flash: No News Is…No News
Read More From MVOn Wall Street, traders and other denizens of the market have their own way of processing the daily news feed. Generally, every news item gets processed through the prism of what it might mean for interest rates, taxes and (maybe) one or two other things that markets care about. When you wonder why the pundits on CNBC are all excited about a bad jobs report, it means that the Street is abuzz with hopes for a looming Fed funds rate cut. Bad news is good news, in other words. Throw in a few bad macroeconomic reports, and there might be...
Read MoreMV Weekly Market Flash: It’s Shutdown Time Again
Read More From MVStop us if you’ve heard this one before. The US government shuts down for some defined span of time, markets barely notice, and for everyone who doesn’t work for the federal government, life goes on more or less as normal. Well, there might be some disgruntled folks at closed national parks, if it gets that far. But that’s about it. So it looks like the government will be shutting down again next week, on September 30, unless some completely unexpected series of talks emerge between the parties, where currently none exist. So, more of the same, right? Or is this...
Read MoreMV Weekly Market Flash: Confusion in the Jobs Market
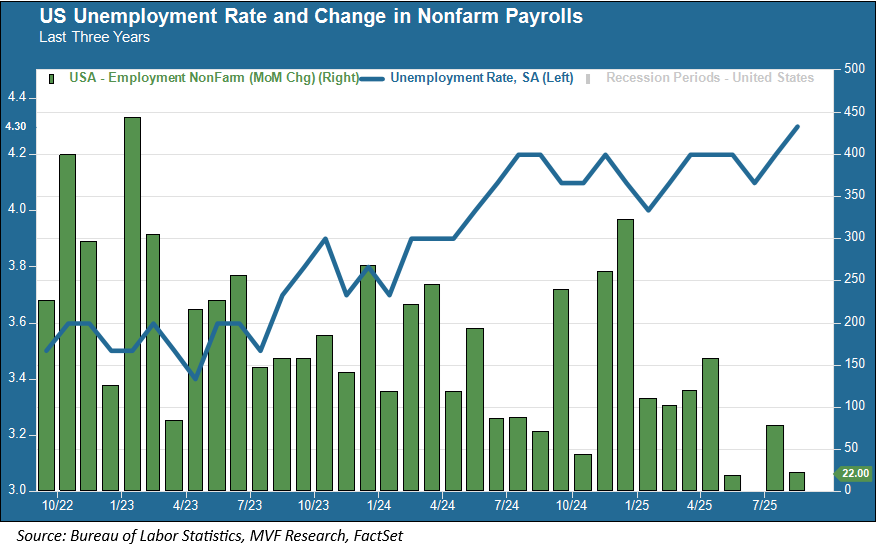
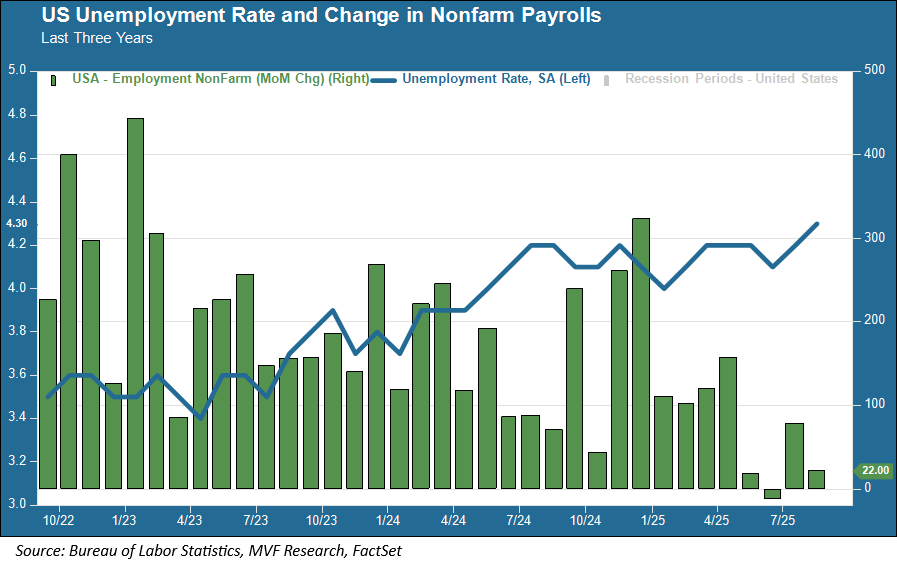
Read More From MVPick a number, any number. That was, more or less, how Fed chairman Jay Powell responded to a question posed by a journalist in this week’s post-FOMC press conference about the current state of the labor market. Specifically, the journalist was asking about the breakeven rate – the number of jobs employers have to create every month to keep the unemployment rate from going up as new job seekers come into the market. NFP Roulette “If you said between zero and 50,000 you’d be right” was Powell’s wry response to the question, referring to the quantity of nonfarm payroll (NFP)...
Read MoreMV Weekly Market Flash: Melt-Up Ahead?
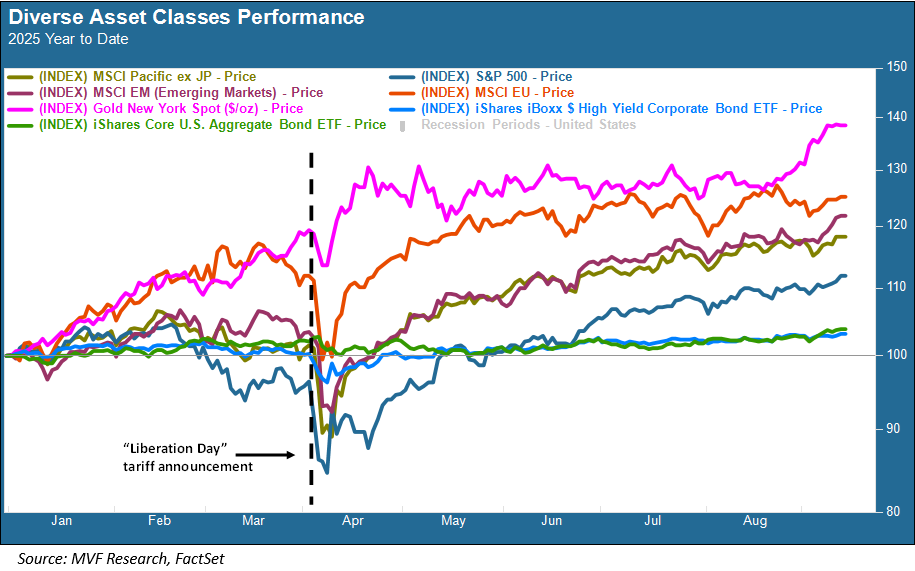
Read More From MVIf you had told anyone following financial market trends on April 2 this year that by September just about any asset class under the sun would be basking in positive returns for the year, they would have called you crazy. But the doom and gloom of the “liberation day” tariff announcement quickly dissipated, and since then the markets have learned to take each and every curve ball thrown their way in stride, shrugging off any longer-term implications while reveling in the joys of a short-term sugar rush. Everything from gold to emerging market and European equities to our own S&P...
Read MoreMV Weekly Market Flash: Bonds Rebound (For Now) as Jobs Outlook Worsens
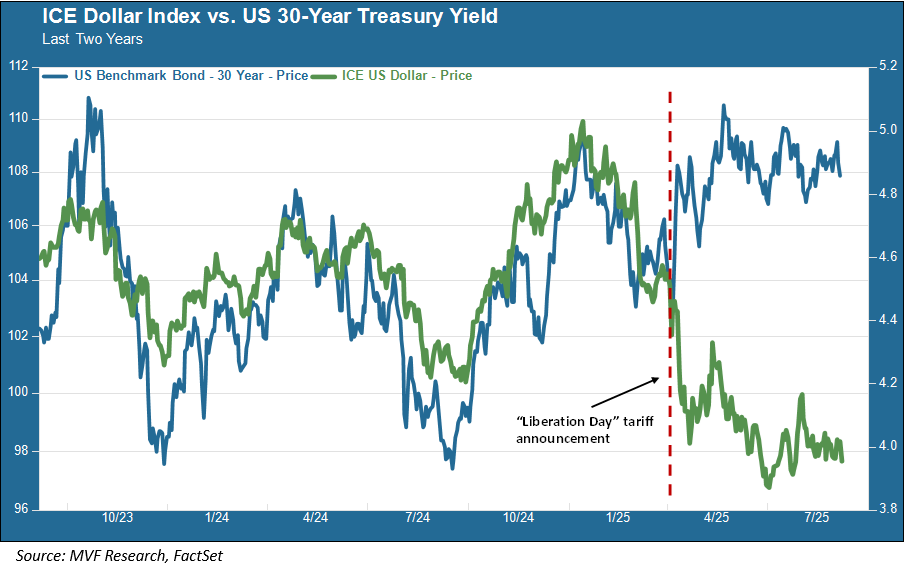
Read More From MVBonds were all anyone in financial circles could talk about as the post-Labor Day market cranked into gear. The US 30-year Treasury bond was nudging five percent, while UK gilt yields soared past levels last seen in the late 1990s. Stagflation-induced bond weakness was topic number one as the customary Brady Bunch-like panels of talking heads gabbed on CNBC and Bloomberg News. What was the Fed going to do – even if it were to manage to remain independent – when its two tasks of maintaining stable prices and promoting maximum employment were in direct conflict with each other? Labor...
Read MoreMV Weekly Market Flash: Revenge of the Gold Bugs
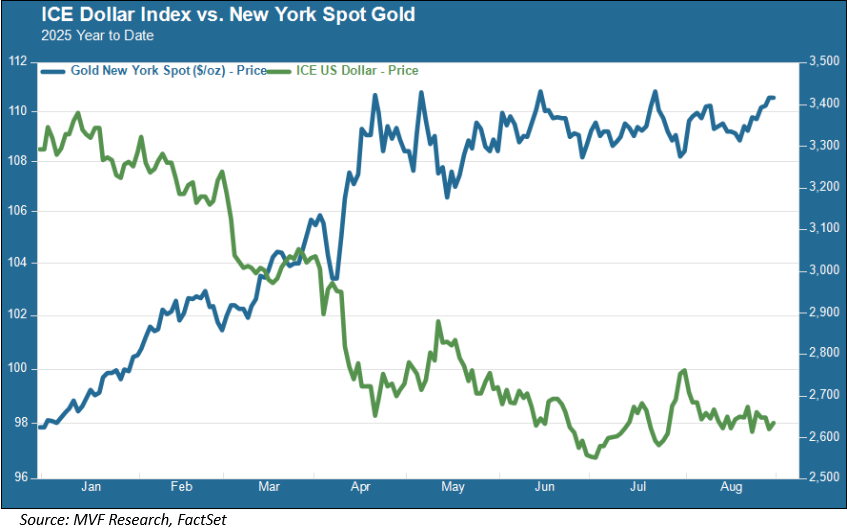
Read More From MVThe gold bugs are one of the more colorful subcultures among the sprawling highways and byways of global financial markets. Mind you, investing in gold returns nothing to its buyers other than the hope that the price will go up as opposed to down. No dividends, no interest coupons to clip, no other sources of periodic cash flows delivered to your account. Just a promise based on the storied history of thousands of years as a sought-after decorative commodity and the lingering aura of the time, a century and more ago, when nearly all the principal national currencies of the...
Read MoreMV Weekly Market Flash: It’s AI Freak-Out Time Again
Read More From MVStop us if you’ve heard this one before. The whole investor world is piling into stocks with a hot AI story to tell, driving prices into the stratosphere. Then, out of nowhere, something comes along – a research piece, an offhand comment by someone at the center of the AI universe – that pours cold water over the bullish vibes. Suddenly, everyone is talking up “rotation” and “equal-weighted index” and running as fast as their little legs will take them away from all things AI. The Rotations That Weren’t Well, we have arrived at the midsummer-2025 version of this dance,...
Read MoreMV Weekly Market Flash: Forecast for Jackson Hole Is Cloudy and Unpredictable
Read More From MVWell, it’s that time of the year again (seriously, how did it get to be the second half of August already?). The world’s great and good central bankers will meet, as they always do, amid the soaring peaks of the Grand Tetons that ring the posh ski resort town of Jackson Hole, Wyoming for their annual confab, ending with a much-anticipated valedictory by Fed chair Jerome Powell. The weather forecast for next week looks appropriately delightful for the bankers, with highs in the mid-80s and lows in the 40s and 50s. The intellectual atmospherics may be rather more unsettled, though....
Read MoreMV Weekly Market Flash: The Eternal Debate Over Valuations
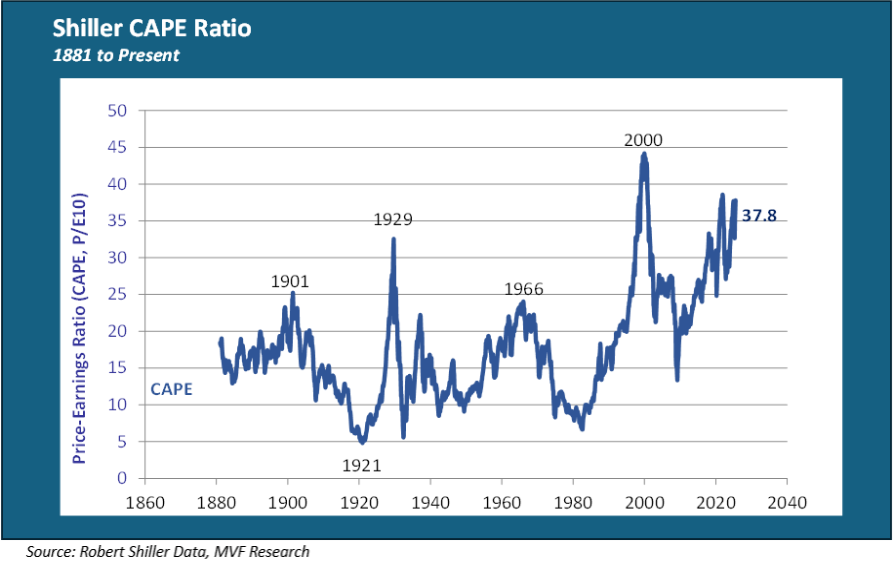
Read More From MVThe US stock market’s performance since the dark days of April has truly been something to behold. On April 8 the S&P 500 had fallen by 18.9 percent from its previous record high, set on February 19. On April 9, of course, the Trump administration punted its “Liberation Day” tariff plans three months down the road, and the markets took off. By the time that three-month pause came due, on August 1, the blue chip index had risen almost 28 percent from the April 8 low. Good times, if they can be maintained. What About the Denominator? But with that...
Read More