Meet Our Team
MV Weekly Market Flash: The Great Rotation Debate
MV Weekly Market Flash: Will the Bond Market Listen This Time?
MV Weekly Market Flash: Two Cheers for the New Bull
MV Weekly Market Flash: The Strangest of Job Markets
MV Weekly Market Flash: Narrow Is The Gate For Outperformance
MV Weekly Market Flash: All Quiet On The Equity Front
MV Weekly Market Flash: Tales of the Pause
MV Weekly Market Flash: What’s Next for the Economy?
MV Weekly Market Flash: Debt Ceiling Drama, Past and Present
MV Weekly Market Flash: Memos and the Market

MV Weekly Market Flash: The Great Rotation Debate

Read More From MV

A few weeks ago we took note of the lack of breadth in the US stock market rally this year, with a small number of outsize tech companies (mostly with a good AI story to tell) driving the lion’s share of gains in the year to date. Since that time there has been a flurry of commentary among the financial chattering class about a possible rotation on the horizon. Is there anything to the chatter, or is the putative rotation out of mega-cap growth into…well, something else, just words with which to fill up the minutes on CNBC’s “halftime report”...

Read More

MV Weekly Market Flash: Will the Bond Market Listen This Time?

Read More From MV

Going into the Federal Open Market Committee meeting this week, the over-under was a bit tighter than usual. In the previous meeting in early May, Fed chair Powell had telegraphed pretty convincingly that the Committee was likely to pause in the June meeting. Since then, though, a flurry of Fedspeak – along with more robust job numbers and still-high core inflation – suggested that another increase might be in the works. In the end, the kibbitzing settled around a consensus view that the Fed would “skip” rather than “pause,” with no rate hike in June but a final 0.25 percent...

Read More

MV Weekly Market Flash: Two Cheers for the New Bull

Read More From MV

Let’s start with the good news. The “two cheers” in today’s headline are for the S&P 500 having clawed back gains of twenty percent from the low point of the index’s price trajectory reached in October last year. Twenty percent isn’t nothing. On Wall Street, in fact, a twenty percent gain is one of those magic milestone numbers signifying a transition from one thing to another, in this case from a bear to a bull. The chart below shows the market’s flight path since it last notched a record high back on January 3, 2022. That’s the good news. The...

Read More

MV Weekly Market Flash: The Strangest of Job Markets

Read More From MV

Where do they all come from? Once again, the jobs market has confounded the experts. Economists expected today’s Employment Situation Survey from the Bureau of Labor Statistics would show an increase of 188,000 nonfarm payrolls for the month of May; instead, we got a whopping 339,000 payroll gains. True, the unemployment rate ticked up to 3.7 percent from last month’s 3.4 percent. But the higher unemployment rate probably reflects a larger cohort of active job seekers, rather than a sign of fewer openings. Indeed, according to a different report that came out earlier this week, the number of vacancies grew...

Read More

MV Weekly Market Flash: Narrow Is The Gate For Outperformance

Read More From MV

The US stock market is having itself a pretty decent year so far in 2023, all things considered. Last week we talked about the market in terms of volatility, namely that there hasn’t been much of that in equities even while bonds have been bouncing around like dragonflies drunk on Adderall. Bank crises, debt ceiling worries, the growing likelihood of a recession? Bonds gyrate while stocks yawn. This week we focus on another unusual characteristic of the stock market – the extreme narrowness of outperformance, dominated almost exclusively by a small number of mega-cap technology companies. Sector Divergence Let’s take...

Read More

MV Weekly Market Flash: All Quiet On The Equity Front

Read More From MV

Once upon a time, there was a quaint little thing called the “risk frontier,” a staple of textbooks teaching the theory and practice of investment management. Stocks for growth, bonds for safety was the underlying mantra. You put a mix of equities and high-quality fixed income securities into a portfolio based on your goals for growing your money (equities) and at the same time preserving your capital against periodic volatility (bonds). It’s called the risk frontier because you can plot it in a linear fashion on a 2-axis risk and return graph: lower risk, lower return for the safety plays,...

Read More

MV Weekly Market Flash: Tales of the Pause

Read More From MV

Last Wednesday, Fed chair Jay Powell strongly suggested that the 0.25 percent rate hike the FOMC voted for that day would be the last one for some time. We now find ourselves – probably, because nothing is certain – in a pause period after a prolonged series of rate hikes for just the sixth time in the past thirty years. What does that mean? If you tune into CNBC or one of the other financial-news-as-sports media sites you will probably encounter panels of talking heads telling you what the market “does” when the Fed pauses after a monetary tightening program....

Read More

MV Weekly Market Flash: What’s Next for the Economy?

Read More From MV

We have had quite a bit of data dumped on us recently, with even more to come before this week is over as we are writing this before the publication of the BLS April jobs report later this morning. There is a lot to analyze, and some conflicting signals. Let’s start with the Fed. Meaningful Change Jay Powell couldn’t say outright that the Fed is done with raising rates, but he performed an exceptionally clear pantomime of saying exactly that during the post-FOMC press conference on Wednesday. In the official press release the phrase “some additional policy firming may be...

Read More

MV Weekly Market Flash: Debt Ceiling Drama, Past and Present

Read More From MV

The debt ceiling is the financial markets equivalent of the Night of the Living Dead – a zombified relic of some ill-conceived legislation from long ago that lies dormant until Congress has to start talking about it again, at which point it rises and stalks the earth until some brave posse of bipartisan stalwarts – hopefully – put it back in the ground with a continuing resolution or a temporary spending measure or some other means of deferring the problem to another day. The creature is alive once more, and nerves may be on edge for some time between now...

Read More

MV Weekly Market Flash: Memos and the Market

Read More From MV

Financial theory teaches us that market prices are driven by the outcomes of perfectly rational creatures making split-second decisions fine-tuned to the optimal net present value alternative. pulsebeverage.com Those of us who live in the practical world of investment management know that this particular slice of financial theory is, not to mince words, bunk. Markets are many things, but perfectly rational they are not. takla.projects.coppertable.co.za Still, we are sometimes surprised by how willfully irrational markets can be. Perhaps none more so, in recent times, than the bond market. sms-marketing.grMemo To: Market, From: FOMC, Re: Rates There has been a distinct...

Read More
MV Weekly Market Flash: The Great Rotation Debate

A few weeks ago we took note of the lack of breadth in the US stock market rally this year, with a small number of outsize tech companies (mostly with a good AI story to tell) driving the lion’s share of gains in the year to date. Since that time there has been a flurry of commentary among the financial chattering class about a possible rotation on the horizon. Is there anything to the chatter, or is the putative rotation out of mega-cap growth into…well, something else, just words with which to fill up the minutes on CNBC’s “halftime report” and its ilk?

Impressive, But Not Unprecedented

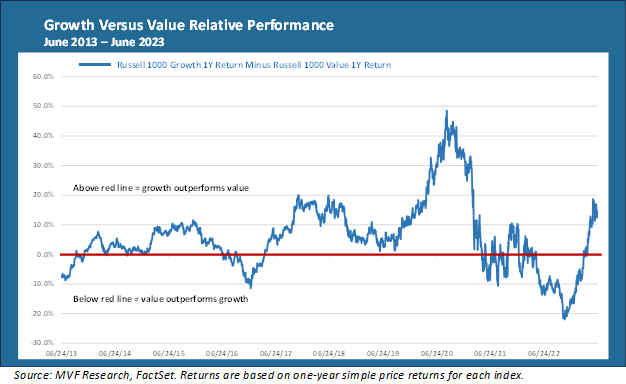
The performance of tech and other growth-related stocks has indeed been impressive this year. The Russell 1000 Growth index, as of the June 22 close, was up around 26.4 percent since January 1, while its counterpart the Russell 1000 Value index was up a paltry 1.7 percent. That’s a pretty big gap – no wonder those “rotation” chyrons were flying across the financial TV screens. But we’ve been here before. In fact, when we’re talking about growth outperforming value, we’ve been here quite often in recent years. In the chart below we show the relative performance of growth versus value for the past ten years.

Each data point in the above chart represents the difference between the one-year Russell 1000 Growth index return and the one-year Russell 1000 Value return. If the difference is positive, i.e. above the horizontal red line, it signifies growth outperforming value. Every data point below the red line indicates a period of outperformance by value over growth. As the chart makes clear, the last ten years have been dominated by growth stocks (most often, though not always, by the mega-cap leaders), and never more so than in the heady days of the pandemic. That all changed last year, of course, when the Fed began its monetary tightening program and growth stocks took a hit. Value stocks had their best run in the last decade during this period.

No Magic To Mean Reversion

Over time, either-or propositions like value versus growth will cycle back and forth. Some investors look at these charts, with their seemingly inevitable mean reversions, and figure there is a way to calculate these cycles and profit from timing them. We, however, do not subscribe to that school of thought. Mean reversion is not driven by anything other than thousands of market factors at play that generally only make sense in hindsight. Trying to interpret these factors in real time can lead to misguided convictions.

For example, there was a brief period of outperformance by value stocks in late 2016 that was driven largely by a whopping misconception on the part of investors that the forthcoming administration of Donald Trump was going to unleash a torrent of infrastructure spending that would “reflate” the economy and drive interest rates up. No such reflation (or infrastructure, for that matter) happened, and in due time the market figured that out. More recently, the market’s complacency about inflation and the Fed’s response to inflation caught quite a bit of the so-called smart money flat-footed in last year’s reversion to value stocks.

So is there another Great Rotation brewing? It’s certainly possible. As we have noted many times in the past several months, the market’s expectations for a near-term Fed pivot to cutting interest rates were out of step with what the Fed itself was actually saying – and that misreading of the FOMC’s tea leaves has arguably been one contributing factor to growth’s outperformance in 2023 (though the bigger story there, as we recently pointed out, is the market’s newfound obsession with everything AI). Now investors are bracing for not just one, but potentially two more rate hikes before the Fed decides to hold – and potentially hold for a long time if those sticky service-sector prices refuse to budge. That could give a further tailwind to value.

On the other hand, we are also seeing a renewed focus on the potential for a recession. The yield curve is once again flirting with its widest inversion since the peak of the Volcker era more than 40 years ago. Those concerns could be particularly hard on sectors like financials, energy and industrials that feature prominently in value indexes.

What we are seeing in the market today though, for what it’s worth, is more directionless than anything else. Playing things close to the center is perhaps the most advisable strategy for the time being.

MV Weekly Market Flash: Will the Bond Market Listen This Time?

Going into the Federal Open Market Committee meeting this week, the over-under was a bit tighter than usual. In the previous meeting in early May, Fed chair Powell had telegraphed pretty convincingly that the Committee was likely to pause in the June meeting. Since then, though, a flurry of Fedspeak – along with more robust job numbers and still-high core inflation – suggested that another increase might be in the works. In the end, the kibbitzing settled around a consensus view that the Fed would “skip” rather than “pause,” with no rate hike in June but a final 0.25 percent increase in July to bring this eighteen-month monetary tightening program to an end.

One More for Good Measure

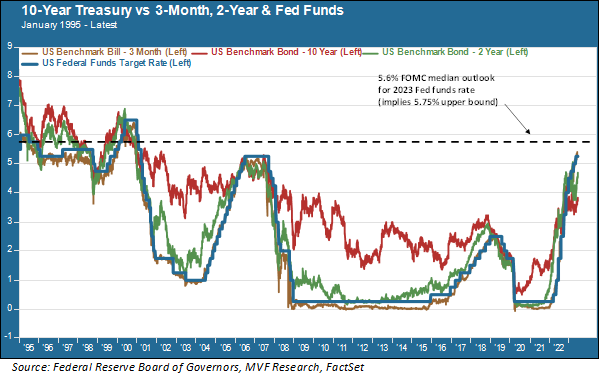
In the end, though, the FOMC had a surprise in store for the market. The Summary Economic Projections, a representation of where Committee members think that certain macroeconomic metrics and interest rates will be in the next several years, showed the median projected Fed funds rate for 2023 to be 5.6 percent. That implies another two – not one – rate hikes, with a final Fed funds range of 5.5 – 5.75 percent (up from the current range of 5.0 – 5.5 percent). If the SEP assumptions become reality (they are only nonbinding estimates at this point), it will represent the highest level for the central bank’s key interest rate since January 2001.

Recent economic data suggest two concurrent trends that may explain the reasoning behind the additional rate hike assumed by the SEP. The labor market is still running hot, a full year and a half since the first rate hike in March 2022. The maximum unemployment rate is projected to be 4.5 percent, lower than the May assumption of 4.6 percent. On the flip side, the SEP assumptions for core inflation are higher than they were in May. In fact, core inflation as measured by the Consumer Price Index has been on an elevated plateau for the duration of this year so far, with a month-on-month gain of 0.4 percent each and every month except February, when it was 0.5 percent. The month-on-month trend at this point is a more important yardstick for the Fed than the year-on-year comparisons. It remains elevated due largely to the stickiness of core categories like shelter, vehicles and transportation services. At the post-FOMC press conference Powell expressed his view that these are likely to continue being more stubborn. Meanwhile, he was more upbeat about the potential for that fabled “soft landing” thanks to the continued strength of the jobs market. Hence the case for that second additional rate hike.

The Bond Market Shrugged

As the above chart shows, the current level of Treasury yields across the spectrum of maturities remains well below the final level implied by the SEP. Intermediate rates, indeed, are positioned well below even where the Fed funds rate is today, let alone where Committee members think it will wind up. This, as the chart clearly shows, is not the historical norm. In all but a small number of time periods, interest rates follow an upward-sloping curve from the shortest to the longest maturities. In the past, when this shape has inverted, it has in most cases been the precursor to a recession.

The inverted yield curve today is one of the longest on record – and we still do not know for sure if it is going to actually prefigure a recession (though that assumption, which we first articulated in our outlook at the beginning of this year, is still in our base case model). One might have thought that the Fed’s SEP surprise this week would have had an immediate effect on interest rates, representing as it does a repricing from current levels. But one would have been wrong. Rates are more or less where they were a week ago, with just a little more movement in the 2-year and the 5-year Treasuries than in the 10-year.

As has often been the case this year, the bond investor is left with a dilemma. Lock in the highest nominal yields in the past 15 years, and assume that inflation-adjusted purchasing power will turn positive sooner or later? Or conclude that the bond market, dripping with recency bias, is still not listening to the Fed, still thinks that a rate-cut unicorn is just around the corner, and is about to get whacked with a stiff dose of reality that sends rates sharply higher? It’s a dilemma without a clear answer (which, we suppose, is what makes it a dilemma in the first place). In our portfolios, bonds serve the dual purpose of safety and yield. The mix of those two objectives will change with the specific financial goals of each client, and that client-specific mix will inform how we respond to the dilemma.

MV Weekly Market Flash: Two Cheers for the New Bull

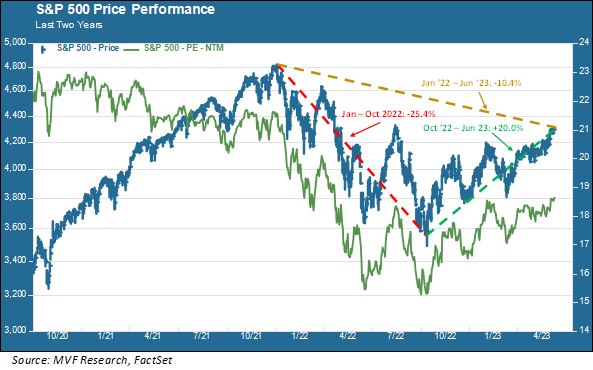
Let’s start with the good news. The “two cheers” in today’s headline are for the S&P 500 having clawed back gains of twenty percent from the low point of the index’s price trajectory reached in October last year. Twenty percent isn’t nothing. On Wall Street, in fact, a twenty percent gain is one of those magic milestone numbers signifying a transition from one thing to another, in this case from a bear to a bull. The chart below shows the market’s flight path since it last notched a record high back on January 3, 2022.

That’s the good news. The one cheer we have withheld from the celebration is the fact that the market’s progress to date from the October low still leaves us around ten percent (10.4 percent to be precise) below that January ’22 record high. We’ll offer a full-throated “three cheers” when the market hits that milestone, which in our opinion has a reasonably decent chance of happening within the current calendar year (remember that “our opinion” does not equate to anything remotely certain, and should not be construed as investment advice).

The Wall of Worry

Market pundits are fond of speaking of the “wall of worry” that stocks climb as they battle through the daily onslaught of risk factors. There have been plenty of those this year – the collapse of several prominent banks back in March, the ongoing tightening of credit conditions and the persistence of higher than desired inflation being prominent among them. In the past couple weeks the bond market seems to have changed its mind on the likelihood of near-term interest rate cuts by the Fed, leading to a narrative shift on monetary policy. Ahead of the FOMC meeting that concludes next Wednesday, the new consensus thinking is that the Fed may “skip” as opposed to “pause” – in other words, keep rates where they are for now, but likely raise them again for perhaps one final time in July. That’s a far cry from the consensus as recently as a month ago that June and July could see a Fed pivot to cutting rates.

All those things could still pour cold water on the stock market rally. So could a change of sentiment around that small number of megacap tech stocks driving the lion’s share of gains so far this year, as we discussed at length in last week’s commentary. This week, though, we have seen some tentative signs of life from other parts of the market that haven’t done particularly well this year, like value stocks and small caps. Perhaps a rotation is in the offing. Valuations in large cap tech stocks are expensive, but the market overall is still relatively moderately priced in comparison to recent historical levels, as shown by the next twelve months P/E ratio (green trendline) in the above chart). If the economy continues to surprise to the upside, e.g. ongoing resilience in the labor market and consumer spending, that could work to the benefit of some of those lagging sectors and asset classes.

Longer Cycles

What we should not assume, any time soon, is that the market will be reverting to the patterns of the previous decade. Throughout the 2010s, downturns vanished almost as soon as they came into being. Remember the “Ebola crisis” of 2014? That consumed investors for all of two days before prices snapped back. Even the more substantial pullbacks of the decade – the near-default on the debt ceiling in 2011 and the attempted monetary tightening in 2018, both of which came within a whisper of that twenty percent bear market threshold – reversed and recaptured the previous record high within a matter of several months. Such are the tailwinds to risk assets provided by the lowest levels of benchmark interest rates in recorded history.

Those days are likely gone, for now at least. We expect to see longer cycles ahead, both for growth environments and for reversal periods like 2022. Does this mean that the bull market which officially started at this morning’s opening bell will have an extended run? Nobody knows, of course, but here’s hoping.

MV Weekly Market Flash: The Strangest of Job Markets

Where do they all come from? Once again, the jobs market has confounded the experts. Economists expected today’s Employment Situation Survey from the Bureau of Labor Statistics would show an increase of 188,000 nonfarm payrolls for the month of May; instead, we got a whopping 339,000 payroll gains. True, the unemployment rate ticked up to 3.7 percent from last month’s 3.4 percent. But the higher unemployment rate probably reflects a larger cohort of active job seekers, rather than a sign of fewer openings. Indeed, according to a different report that came out earlier this week, the number of vacancies grew last month – also by more than the consensus forecast of economists.

A Flaw in the Models?

None of this is new. In just about every month so far this year, economists’ predictions have underestimated the strength of the labor market. It’s not unusual for the forecasts to be wrong – there is plenty of variance to be expected from surveys like the BLS report that collect sample sets of data from a defined point in time. But one would expect the variance to cut both ways – higher in some months, lower in others. When they always come in on the low side, that suggests a basic problem with the models.

One problem we can think of that might be affecting the models is the relatively sparse amount of relevant data available from past periods to supply clues as to what might be going on now. The conventional thinking would be that, sixteen months into a draconian monetary tightening program, credit conditions would be tightening, consumer spending would be decreasing and businesses would either be freezing new hiring or laying people off. And some of that is happening – tech and financial firms in particular have been at the forefront of layoffs, and there is some evidence that consumer spending has been slowing in the past couple months. But the jobs keep coming. Those tech layoffs may capture business news headlines, but there is evidence that those let go from Company ABC don’t have much trouble in finding new employment from Company XYZ. Indeed, payroll gains in May were particularly strong in the category of professional and business services, which would include much of the tech and financial sectors.

A combination of factors – the disruption of the pandemic, all the government stimulus money, the combination of supply chain bottlenecks and surging demand that led to the highest inflation in forty years – all this makes it very difficult to put the predictive pieces in place for insightful macroeconomic estimates. The models need fixing – but how to fix them is likely to continue to cofound the modelers. That is a problem with important implications for the rest of the year.

Growth, Rates and the Fed

In two weeks’ time, the Federal Open Market Committee will meet again for what may be the most important monetary policy deliberation of the year. At the last FOMC meeting in early May Fed chair Powell left the distinct impression that the June meeting may result in a pause so that the Committee can evaluate the effect the rate increases to date are having on economic activity. Since then, there has been a perceptible hawkish turn to “Fedspeak” as various members have opined that it may be too early to pause, thus setting the stage for another potential 0.25 percent increase to the Fed funds rate at the June meeting. The last two key data points the Committee will have for that meeting will be today’s jobs report and the May Consumer Price Index report, which comes out a day before the FOMC decides what to do.

On its own merits, today’s jobs report probably nudges the needle a little towards another rate hike. One obvious takeaway from the results of the last year and a half is that the labor market has been able to withstand the most drastic increase in interest rates since 1980. That would give the Fed confidence that it can continue to take bold steps to quash inflation without risking a dramatic spike in the number of jobless Americans. What the Fed hopes to achieve, of course, is that fabled “soft landing” where bringing inflation back to its two percent target is achieved with the least amount of harm done as possible to the economy. If the unemployment rate is still under four percent by the time inflation comes back down, it would be a striking policy win for the central bank.

What remains to be seen is that last data point, the CPI report due out on June 13. Even while the headline CPI number has come down dramatically, thanks mostly to lower energy prices, the core inflation number the Fed focuses on has been stickier. If the June 13 report shows a similar trend from last month – around a 0.4 percent month-on-month increase translating to a year-on-year rate of 5.5 percent – that could be the final push towards another rate hike. Which will then set off another round of concerns about a policy error raising the likelihood of a recession. Which will then lead to more second-guessing as yet another month’s worth of data continues to perplex the experts. Which brings to mind some wisdom from Yogi Berra: predictions are hard, especially when they’re about the future.

MV Weekly Market Flash: Narrow Is The Gate For Outperformance

The US stock market is having itself a pretty decent year so far in 2023, all things considered. Last week we talked about the market in terms of volatility, namely that there hasn’t been much of that in equities even while bonds have been bouncing around like dragonflies drunk on Adderall. Bank crises, debt ceiling worries, the growing likelihood of a recession? Bonds gyrate while stocks yawn.

This week we focus on another unusual characteristic of the stock market – the extreme narrowness of outperformance, dominated almost exclusively by a small number of mega-cap technology companies.

Sector Divergence

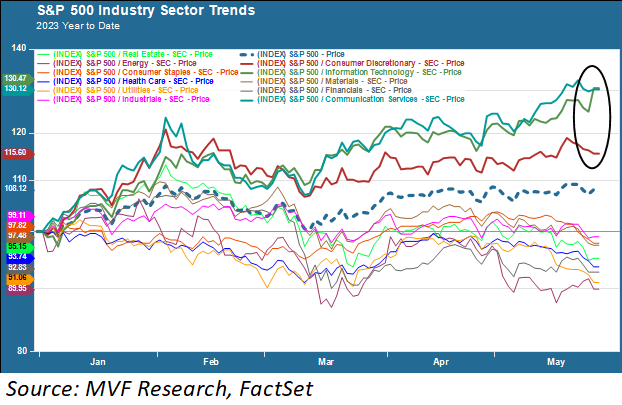
Let’s take a look at the evidence. First of all we present a chart showing the year-to-date performance by industry sector. Notice here that three sectors – information technology, communications services and consumer discretionary, highlighted on the chart by the circle – are the only ones outperforming the broader index. The other eight, ranging from industrials to energy, all trail the benchmark.

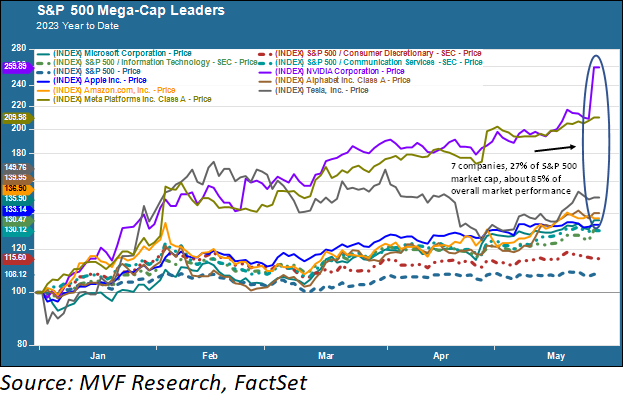
We noted above that outperformance in the market this year is confined narrowly to a small number of “technology companies.” So what explains the outperformance of those other two sectors, communications services and consumer discretionary? Very simply, those sectors are home to four companies that largely fit the description of “technology.” The communications services sector contains both Meta (Facebook) and Alphabet (Google), while consumer discretionary is where online behemoth Amazon and EV bellwether Tesla reside. Now, in the chart below, we will see why those four companies (alongside three companies in the info tech sector) have an outsize effect their sectors and the market.

Here they are – the Big Seven that collectively explain about 85 percent of the total performance of the S&P 500 in the year to date: Alphabet, Amazon, Apple, Meta, Microsoft, Nvidia and Tesla. These seven companies account for about 27 percent of the total market capitalization of the benchmark index. It is largely thanks to them that investors with passive exposure to the broad index are enjoying returns in the high single digits so far this year.

Interest Rates, Repositioning and AI

What has been driving this outperformance? We see three key factors. First, these are all technology-driven companies, and tech names tend to enjoy a disproportionate benefit, relative to other sectors, when interest rates come down. Early in the year this was a key factor; after a couple modestly favorable inflation reports late last year, the market seized on a narrative that the monetary tightening cycle was coming to an end and the Fed was about to turn on a dime and start cutting (that narrative has since been shown to be lacking in any kind of evidentiary context).

When the Fed pushed back hard against the market’s rate cut fantasies in the February FOMC meeting, rates started to rise again. The tech names didn’t really miss a beat, though, because of another factor at play. Whereas “defensive stocks” once conjured up the image of staid utility companies and cash flow-predictable defense contractors, that moniker now applies to Big Tech more than anything else. The economy’s fortunes may rise and fall, but Apple, Microsoft and their ilk aren’t going anywhere. As the banking crisis in March caused ripples of concern elsewhere, investors kept turning to tech for safety.

But arguably the biggest explanatory factor for the dominance of the Big Seven is neither interest rates nor defensive repositioning, but rather the buzzword that has totally taken over the imaginations of Silicon Valley – artificial intelligence. If you want a visual for this, just look at the price trendline in the chart above for chipmaker Nvidia (the purple line). This stock popped by 25 percent in just one day (yesterday) after releasing its first quarter earnings report. Nvidia makes graphic processors that power generative AI-driven applications and large language models, and has a leading position in supplying its processors to the Microsoft/OpenAI strategic venture that has been the talk of the Valley this year. Unlike some other tech crazes of late, this one looks pretty solid in terms of hard numbers. The frenzy in Nvidia shares yesterday came mostly from the company’s outlook on forthcoming sales to cloud and internet companies, as well as automotive, financial, healthcare and telecoms concerns. To one extent or another, all the Big Seven companies have a case to make that they are at or somewhere close to the leading edge of the generative AI explosion.

Narrow Performance, Wide Risk

While it has been nice to have the biggest names in the S&P 500 drag the market higher so far this year, there is understandably some concern in the market about what will happen if the factors driving outperformance start to go the other way. According to a recent report from Bespoke Investment Group, the three-month performance spread between the market cap-weighted S&P 500 (which is the one used as a market benchmark) and an equal-weighted variation is wider than it has been any time since 1999. The report goes on to note that an equal-weighted basket of those Big Seven stocks is up 70 percent year-to-date, while the other 493 stocks in the index are up only 0.1 percent (again, on an equal-weighted basis). And 275 companies in the index are in negative territory for the year so far.

All of which is to say that we don’t have too much to complain about as the second half of the year approaches – but there is still a long way to go.

MV Weekly Market Flash: All Quiet On The Equity Front

Once upon a time, there was a quaint little thing called the “risk frontier,” a staple of textbooks teaching the theory and practice of investment management. Stocks for growth, bonds for safety was the underlying mantra. You put a mix of equities and high-quality fixed income securities into a portfolio based on your goals for growing your money (equities) and at the same time preserving your capital against periodic volatility (bonds). It’s called the risk frontier because you can plot it in a linear fashion on a 2-axis risk and return graph: lower risk, lower return for the safety plays, moving out sequentially to lower-grade bonds, preferred stock, blue chip common stock, emerging markets, venture capital – you get the idea.

Wild Times At The Two-Year

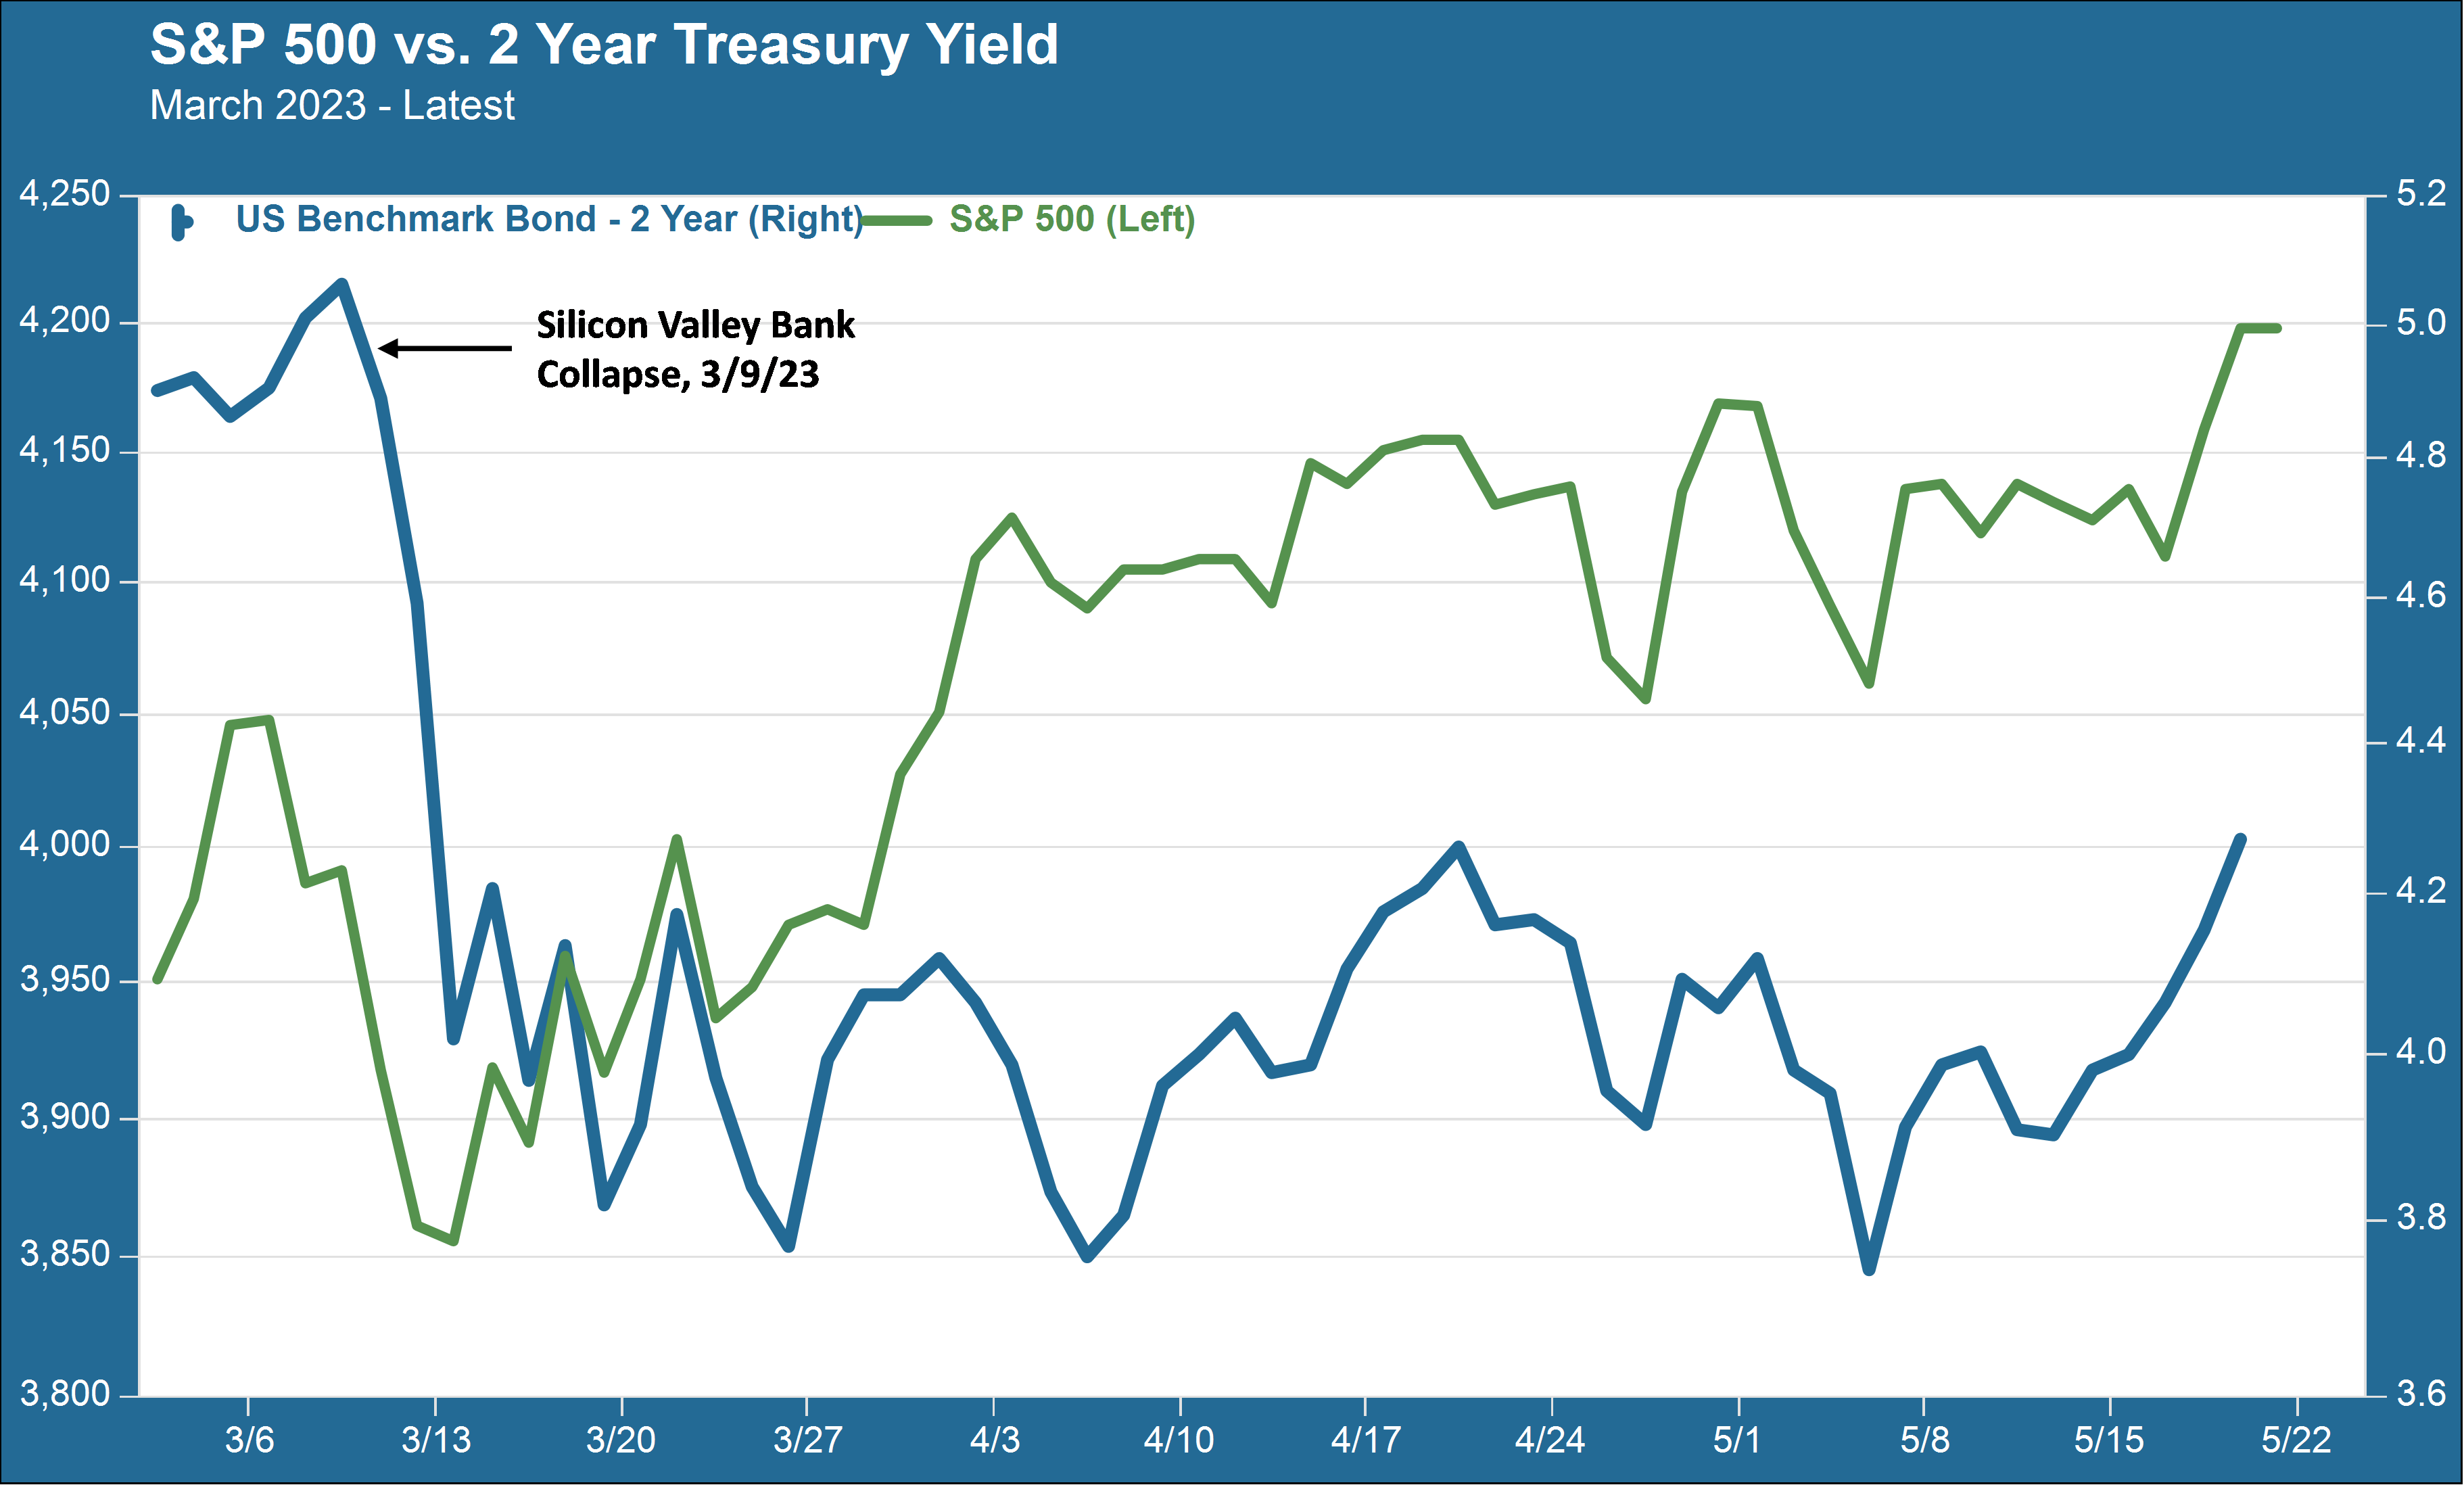
With that in mind, consider the chart below and see if you could figure out (without looking at the descriptive legend) which of these two lines represents the S&P 500, an index of large-cap US common stocks, and which one represents the yield on the two-year US Treasury note, a security backed by the full faith and credit of the US government that otherwise goes by the name “risk-free rate.”


They both bounce around a bit – right? But the blue line seems to be bouncing around quite a bit more, from that big plunge back in March to some outsize sideways lurches and then to a big jump upwards in the past several days this week.

The blue line, of course, is the two-year Treasury yield. Trading in this particular maturity of Treasury securities has been particularly frenetic since the collapse of Silicon Valley Bank back in March (the event that precipitated that massive plunge in the yield). This is more than a little strange. The two-year is sort of an endpoint for what we think of as the “short end” of the yield curve. The short end is supposed to be influenced by one factor above all others – the interest rate policy set by the Federal Reserve and represented most directly by the Fed funds rate, an overnight rate that the Fed directly targets through its open market operations. The Fed funds rate is currently set in a target range of 5.0 – 5.25 percent, following the most recent rate hike announced earlier this month. The Fed funds rate did not come down as a result of the banking sector troubles following the SVB collapse. But other short-term rates did, and they’ve been jumping up and down in a more or less sideways pattern ever since (prior to this most recent week, which we’ll come to in a minute).

Stocks For Safety?

Meanwhile, conditions in the equity market have been unusually placid. A report from Bloomberg News this morning noted that the S&P 500 is so far having its quietest quarter since 1993. Yes – there was a bit of a pullback immediately after the banking crisis, but things calmed down quickly when it became apparent that SVB and the small number of other failing banks was not shaping up to be a full-scale financial crisis in the manner of 2008. Part of the recent strength in equities has to do, in fact, with the big plunge in interest rates. Growth-oriented stocks, which are more sensitive to changes in interest rates due to the more variable nature of their cash flow models, have led the recent rally (in particular, a very small number of mega-cap tech stocks). Resilience in these parts of the market have proved more than adequate to offset the ongoing jitters that affect stocks in the banking sector.

Congress And The Fed

This week’s outsize moves in Treasury yields suggest that the mostly sideways pattern of the past couple months may be giving way to a more sustained directional move upwards (though this is of course by no means certain). There seem to be two factors at play.

First, we think it may finally be beginning to dawn on the bond market that a Fed “pivot” – a near-term reversal of monetary policy with a move to cutting rates – is extremely unlikely. We have been banging on about this for weeks now – after the SVB collapse, bond yields reset at levels suggesting that the market was pricing in some 0.6 percent or so in rate cuts before the end of 2023, possibly beginning in June. Well, June is just around the corner, and the only Fedspeak we’re hearing these days is either pause and hold (Powell, at the May FOMC press conference) or even one more rate hike when the Committee meets in several weeks from now. We have been perplexed by the market’s sticking fingers in its ears and shouting “la-la-la” every time Powell or another Fed figure says that no rate cuts are on tap for 2023.

Then there is Congress, and the always-unfortunate political theater of the debt ceiling. It remains highly unlikely that a default will occur when the Treasury runs out of money on or sometime shortly after June 1 (according to Treasury Secretary Janet Yellen). On the other hand, June 1 is closer today than it was two weeks ago. It should not be surprising that some amount of concern about a default is showing up in bond yields – this is particularly true of the 1-month yield, since the 1-month now comes due in the second half of June, which means either a new debt ceiling is in place or the paper is worthless.

On the equity side, though, any concerns about a debt ceiling debacle are not showing up in recent price movements. Quite the contrary. We are sometimes guilty of making sport of the stock market’s “common wisdom.” This time, we’re hoping that wisdom is correct and on target.

MV Weekly Market Flash: Tales of the Pause

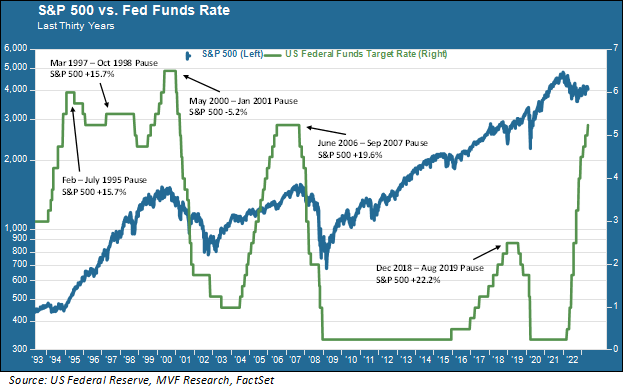
Last Wednesday, Fed chair Jay Powell strongly suggested that the 0.25 percent rate hike the FOMC voted for that day would be the last one for some time. We now find ourselves – probably, because nothing is certain – in a pause period after a prolonged series of rate hikes for just the sixth time in the past thirty years. What does that mean? If you tune into CNBC or one of the other financial-news-as-sports media sites you will probably encounter panels of talking heads telling you what the market “does” when the Fed pauses after a monetary tightening program.

If you are a longstanding reader of our weekly column, of course, you will not be surprised when we make the case that every time is different, because the circumstances are different, and also that a sample set of five prior observations in a thirty year period falls way short of statistical significance. That being said, it can be useful for context to have a perspective on past events. So here goes.

Variable Timing

One thing you can easily see from the above chart is that there is no particular fixed amount of time that rates spend in the pause position. The shortest pauses in this 30-year period were the six months time-out in 1995 and the eight month wait-and-see in 2019. As we will discuss further below, this is an interesting comparison because of a similar motivation for the rate cuts that took place in October 1995 and August 2019.

The pause periods that began in 1997 and 2006, by contrast lasted more than a year. This is a useful thing to keep in mind when we look at what is going on in the bond market today. As we have noted in recent columns, bond investors remain confident that the Fed will start cutting rates as soon as June or July. That seems out of line with historical observation; if the Fed were to announce a rate cut at, say, the July 26 FOMC meeting then it would constitute the shortest pause in the past thirty years. What gives the bond market so much confidence in this scenario?

Insurance Cuts

Perhaps the bond market is thinking about those 1995 and 2019 pause periods in coming up with an abbreviated schedule for the current one. When the Greenspan Fed began raising rates in early 1994, it was interested in demonstrating its inflation-fighting credibility. The rate hike in February of that year took the market by surprise, causing a sharp but brief drop in equity markets. The decision to begin cutting rates in July 1995 was seen as an “insurance” move; in other words the FOMC was satisfied with where inflation was at the time and sought a bit of pre-emptive insurance to protect against a possible recession. Of course, the recession never happened, and instead the second half of the 1990s was one of the strongest economic growth periods ever.

In 2019 the thinking by the Powell Fed was somewhat similar. You may recall that in late summer of that year the yield curve was flattening (it would actually invert for a very brief period in September). Inflation was well contained within the Fed’s two percent target, so the FOMC didn’t see much downside to a little monetary stimulus in case a slowdown turned into a recession.

The problem with using 1995 and/or 2019 as a guideline for 2023, of course, is that inflation today is in a very different place. We got another reading this week with the April CPI report, and while it continued to show moderating price growth, the fact is that inflation remains well above the Fed’s target and most economists envision a longer period before we see a return to a sub-three percent CPI.

Pause Before the Storm

Then there are the other times when the pause period ended, not because of recession insurance but because the fire was already raging. In 1998 the motivating factor was the Russian debt crisis that led to the collapse of a systemically connected hedge fund, Long Term Credit Management. In 2001 the collapse in tech stocks was already well underway and dragging the real economy down with it. September 2007 was when a number of short-term credit markets seized up, prefiguring the total meltdown that would happen the following year. And in 2020, the Covid-19 pandemic shut down the global economy.

One of the points we have been arguing throughout this year is that we envision a relatively mild cyclical recession happening sometime in the not too distant future, with the “mild” adjective dependent on the absence of some external shock to the financial system. Those external shocks are what precipitated the deep cuts of 2001, 2008 and 2020. If we get a similar seismic event this year then, yes, we imagine that playbook will be put to use this time as well. If we don’t get such an event, which is certainly what we hope, then we do not see where the case for a summertime rate cut materializes.

As for what can be expected in the way of stock market returns? Take your pick. The S&P 500 delivered double-digit gains in four out the five previous pause periods. For entirely different reasons each time, none of which have any real relevance for today. Que sera, sera.

MV Weekly Market Flash: What’s Next for the Economy?

We have had quite a bit of data dumped on us recently, with even more to come before this week is over as we are writing this before the publication of the BLS April jobs report later this morning. There is a lot to analyze, and some conflicting signals. Let’s start with the Fed.

Meaningful Change

Jay Powell couldn’t say outright that the Fed is done with raising rates, but he performed an exceptionally clear pantomime of saying exactly that during the post-FOMC press conference on Wednesday. In the official press release the phrase “some additional policy firming may be appropriate,” a staple of every press release since March 2022, was conspicuously absent. Powell made a point of saying, during the press conference, that the omission of that language was “meaningful.” As in, don’t expect to see another rate hike in June unless the inflation reports between now and then are insanely higher than anyone expects. The pause period is here.

But the rate cut period is not here, repeat, not here. When the question came up during the press conference, as it was certainly going to, Powell was ready. No vacillating in a way that could be misinterpreted by investors. We have no plans to cut rates in 2023, he said for something like the two-hundredth time this year. And yet where did interest rates go after that comment? Down, of course. The two-year Treasury yield is around 3.8 percent right now, which is 1.2 percent below the Fed funds rate’s new lower bound of 5.0 percent. Yes, the bond market still thinks rate cuts are going to start as early as June. We have nattered on about this time and again in recent commentary, but that’s because the bond market’s willful insistence on fighting the Fed still mystifies us.

Consumers Holding On, For Now

Powell did sound reasonably upbeat about the economy’s chances of avoiding a hard landing, which puts him somewhat at odds with the general consensus among economists that the downturn is nigh. Our own take on this for some time has been that the economy is likely to experience a mild and brief cyclical recession, but nothing more serious in the absence of a parallel financial crisis (we’ll come back to this point below). What do the latest numbers tell us?

Let’s consider last week’s preliminary estimate of first quarter real GDP growth. The headline number was quarter-on-quarter growth (annualized) of 1.1 percent. That represents a meaningful slowdown from the previous quarter’s rate of 2.6 percent. But consumer spending in the Q1 report was actually pretty good, coming in at 3.7 percent. Notably, it was big-ticket items like cars and major appliances that showed the highest growth rate. In fact, consumers are still spending more than we would have expected them to be spending at this point given the slowdown in household disposable income and the rise in credit balances.

We’re seeing signs of consumer resilience in some of the earnings reports coming out as well. Companies like Procter & Gamble which are benchmarks for consumer spending trends appear to be operating from the same playbook as last year in keeping profit margins high through charging higher prices even while volumes in many categories remain flattish. This trend may not last for much longer, depending largely on whether the labor market continues to run hot. Here again we have some conflicting signals. A report earlier this week showed that job vacancies have fallen to their lowest levels in two years, which suggests that the market is beginning to cool off. However, another survey released a day later showed job gains coming in at twice the rate economists expected. We’ll have to see, of course, which way today’s forthcoming BLS jobs report points. For now, though, the consumer seems to be doing okay.

The Credit Conditions Curveball

When we used the phrase “absence of a parallel financial crisis” a few paragraphs above, what comes to mind first and foremost is the fact that instability in the regional banking industry has not gone away. A handful of West Coast lenders have been in the crosshairs this week, with plunging share prices and talk of “strategic options” which usually means “looking for a white knight to buy us.” The banks at the center of the unrest include PacWest and Western Alliance (the latter, though, denies that it is actively seeking a buyer and notes that its deposits have actually risen by more than $1 billion since the end of March).

It is noteworthy that the very first thing Jay Powell said in his opening remarks at yesterday’s press conference was that conditions in the banking sector had markedly improved since March and that the system itself was sound. That has been our understanding as well, as we have noted in several recent commentaries. Nonetheless, it is a fact of life that banks rely on confident depositors to stay healthy, and those depositors can get spooked very quickly if they perceive that their money might be at risk. If you are, say, a PacWest depositor and you see that PacWest’s stock has fallen by 50 percent in one day, then your brain’s limbic fight-or-flight neurons are likely to start flashing.

We continue to believe that a systemic crisis in the banking sector is a very low-probability event. In the absence of one, our near-term outlook on the economy is, if anything, a little better than it was even two months ago. But we need to pay heed to what might be around the next bend.

MV Weekly Market Flash: Debt Ceiling Drama, Past and Present

The debt ceiling is the financial markets equivalent of the Night of the Living Dead – a zombified relic of some ill-conceived legislation from long ago that lies dormant until Congress has to start talking about it again, at which point it rises and stalks the earth until some brave posse of bipartisan stalwarts – hopefully – put it back in the ground with a continuing resolution or a temporary spending measure or some other means of deferring the problem to another day.

The creature is alive once more, and nerves may be on edge for some time between now and midsummer. The idea of the US government defaulting on its debt – literally by refusing to pay for obligations it has already incurred – should be preposterous. But one-year US credit default swaps, which represent the price of insuring against a sovereign default, are trading at a level of 106 basis points, up from 15 basis points at the start of the year and the highest level since at lest 2008. If you want a contextual picture of what that means, the current credit default swap rate for Greece’s sovereign debt is 46. Now, the one-year CDS market is not particularly liquid, so one should not read too much into it – but anecdotally at least it’s a bit odd that investors currently peg the likelihood of a US default at more than twice the level of that of Greece. Are they really going to go over the edge this time?

The 2011 Playbook

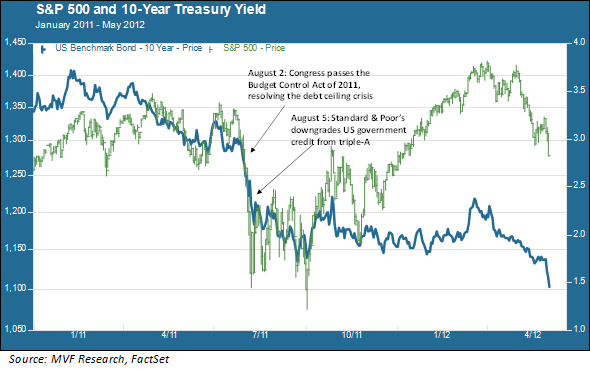
Nobody can predict what the outcome of the current standoff between the Republican House of Representatives and the White House will be (other than the fairly obvious fact that the bill passed by the House earlier this week will go nowhere). But it’s worth taking a look at what happened in financial markets the last time the debt ceiling zombie came close to a scorched-earth outcome, in 2011.

As the chart shows, the 2011 debt ceiling debacle created a considerable amount of volatility in both the stock market and the bond market – and the volatility continued for several months after Congress and the White House narrowly avoided default with the passage of the Budget Control Act on August 2 (followed almost immediately by the S&P downgrade of US Treasuries from triple-A status). The magnitude of loss for the S&P 500 from top to bottom was around 19 percent (the market had fully recovered its losses from the July 2011 peak by February 2012, however). The terms and conditions of the Budget Control Act, unfortunately for anyone wanting some financial market stability, would require then-President Obama to formally request additional debt ceiling increases twice more – in October 2011 and January 2012 – which at least partly explains why markets remained on edge for so long after the bill’s initial passage (on a side note, it is worth considering that the 10-year Treasury yield actually went down, and mostly kept going down, after the S&P downgrade).

Committees to Save the World

So what should we expect this time? Not surprisingly, we have received a fair number of inquiries about this in recent days. One thing that deeply concerns many observers is that the partisan divide is substantially wider and more hostile today than it was in 2011 (and it wasn’t exactly all sweetness and light back then, either). Political folks run the numbers and come up with plausible cases to make that both Republicans and Democrats could talk themselves into short-term advantages from letting the ship go over the edge this time (the advantage coming, cynically, from “winning” the ensuing blame game).

But that is not how these things normally pan out. One thing we have learned over the years – going all the way back to events like the bailout of the hedge fund Long Term Credit Bank in 1998 – is that any crisis with the potential to inflict structural devastation onto financial markets begets an ad hoc Committee to Save the World, which one way or another figures out how to defuse the crisis. We expect that, if political brinksmanship pushes us close to that event horizon of outright default, some assortment of sober-thinking individuals from the Fed, Treasury, White House, Congress and wherever else will come up with something that solves the immediate problem.

We don’t say this with one-hundred percent certainty, because there is no such thing. In the world of risk assessment you are always dealing with probabilities. If the probability of one outcome – a short-term solution – is vastly higher than the probability of another – a sovereign default that lays waste to the entire spectrum of financial assets – then stockpiling cash in anticipation of the low-probability event is a bad idea. Long-term portfolio performance requires the discipline not to flinch when short-term conditions appear volatile. We will continue to share our thoughts on this as the situation evolves in the coming weeks.

MV Weekly Market Flash: Memos and the Market

Financial theory teaches us that market prices are driven by the outcomes of perfectly rational creatures making split-second decisions fine-tuned to the optimal net present value alternative. pulsebeverage.com Those of us who live in the practical world of investment management know that this particular slice of financial theory is, not to mince words, bunk. Markets are many things, but perfectly rational they are not. takla.projects.coppertable.co.za Still, we are sometimes surprised by how willfully irrational markets can be. Perhaps none more so, in recent times, than the bond market. sms-marketing.grMemo To: Market, From: FOMC, Re: Rates

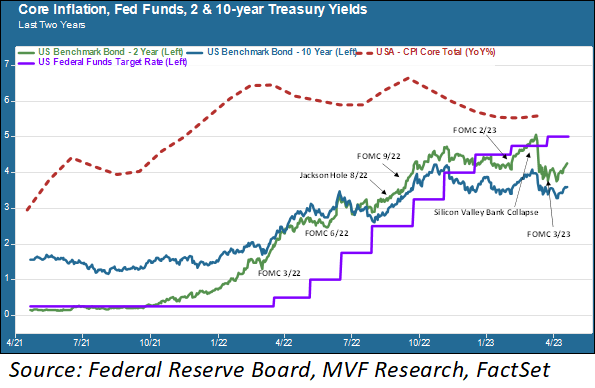
There has been a distinct pattern in the bond market ever since the Fed first began to raise rates in March last year. We think of this pattern in the imagery of a memo from the Fed to the market: hey, we are doing this, please pay attention. And pay attention the market does…sometimes for a few days, sometimes longer, but sooner or later one of two things happens. Either some shiny new thing comes along to distract attention away from the Fed’s stated intention, or investors fall into the behavioral trap of recency bias, assuming that the immediate future is going to look a whole lot like the decade from 2010 to 2020 when the Fed reliably brought rates down every time things started to look a little dicey. We have helpfully charted this dynamic on the chart below.

Here’s what this chart tells us. After the Federal Open Market Committee (FOMC) announced its first rate hike in March 2022 rates predictably went up (we show both the 2-year and the 10-year Treasuries here for illustrative purposes, with more focus on the 2-year because it is typically more sensitive to Fed decisions). Rates actually eased a bit at the 2022 May meeting because investors perceived a “dovish” underlying message from the FOMC. They heard wrong, because in early June the FOMC went ahead with a 0.75 percent rate hike and an accompanying message that bringing down inflation was job numbers one, two and three at the Fed. You can see from the above chart where core inflation (the crimson dotted line) was relative to interest rates at the time of the June ’22 meeting and indeed where it remains today.

Peaks Versus Mesas

But even the 0.75 percent June Fed funds hike was not enough to convince the bond market that rates were going to stay higher for longer (a phrase the Fed has used almost continually throughout this period). Inflation seemed to be levelling off as the summer proceeded. As you can see from the chart, “levelling off” is not the same thing as “peaking and then falling sharply,” which was what seemed to drive market sentiment. The inflation trend looked more like a mesa – roughly flat at an elevated level – and less like the Matterhorn.

But rates trended down until a series of sharply-worded memos seemed to get through to the market in the space of about eight weeks from late July to mid-September. First, another 0.75 percent rate hike at the July meeting. Then, a very hawkish speech by Fed chair Powell at the annual gathering of central bankers in Jackson Hole, Wyoming in April. Finally, a third hawkish 0.75 percent Fed funds hike at the September FOMC meeting.

Bond FOMO

Now we are in fall 2022 and a new dynamic is making itself felt. We all know about FOMO (fear of missing out) in the wackier parts of the market like meme stocks and crypto. But in the staid, buttoned-up bond market? Yep. Investors looked at nominal yields they hadn’t seen for a generation (let’s not talk about real yields, since those were obviously still terrible from a purchasing power point of view) and wanted in. More demand for those yields meant that those yields started going the other way, even though (a) inflation was still high and (b) the Fed kept saying it was going to keep rates – all together now – higher for longer. But self-styled bond gurus showed up on CNBC with their versions of “chance of a lifetime” and the mania was on.

SVB and the Pivot Play

The FOMC meeting at the beginning of February this year was another sternly-worded memo from the Fed to the bond market, and as you can see from the above chart it had the near-immediate effect of cooling off the bullish bond sentiment. Rates on the 2-year Treasury jumped above five percent for the first time since 2007. It looked like the memo might finally have gotten through for once and for all. Then came Silicon Valley Bank.

The biggest US bank failure since 2008 caused an immediate repricing of just about everything related to interest rates and monetary policy. The Fed joined other regulators in the liquidity-providing measures put together in the weekend after the bank’s failure, which led to a new narrative that the Fed was in fact going to start cutting rates. Once again, the narrative had no basis in anything the Fed was actually saying. The FOMC’s March meeting came just 13 days after the SVB collapse. Rates went up by another 0.25 percent. Both Powell’s comments at the post-meeting press conference and the Summary Economic Projections supplied by the Committee members transmitted the message that rate cuts were not in the FOMC’s base case planning scenarios for 2023.

And yet, a Fed “pivot” to cutting rates, to the tune of about 0.6 percent remains priced into where bonds are trading today. We do see in the chart above that rates have crept up a little bit in the past few days. And we regularly hear from a number of prominent figures in the market – today it was Jonathan Gray, president of private equity giant Blackstone – warning that the market is to a great extent ignoring reality in its fixation on the illusory Fed pivot.

We do understand the charms of higher yields that have generated higher demand for high-quality fixed income securities. If you think inflation is going to be back below, say, three percent by sometime in 2024 and you can lock in a five-year nominal yield of four or five percent then there is a logic to that trade. It’s a judgment call (and, frankly, a bet on outcomes that we simply don’t know and can’t know at present). But if you are chasing total return on your bond portfolio because you think rates are going back down to their levels of the 2010s – well, that smacks of recency bias and in our opinion is not a rational course of action given where things stand as of the present. The bond market today is – to use a word that is coming up more and more among participants in it – wacky. It requires care, caution and discipline.

MV Financial

Meet Our Team

Smart Strategies.

Investment Advisor Company